Hodges' Model: Welcome to the QUAD: graphics

Hodges' model is a conceptual framework to support reflection and critical thinking. Situated, the model can help integrate all disciplines (academic and professional). Amid news items, are posts that illustrate the scope and application of the model. A bibliography and A4 template are provided in the sidebar. Welcome to the QUAD ...

Showing posts with label graphics. Show all posts

Thursday, July 30, 2026

Remembering Dr. Gilberto Cárdenas - Self Help Graphics

 Continued ...


My source:  Self Help Graphics & Art, 1300 East 1st Street, Los Angeles, CA, 90033, United States

Sunday, July 05, 2026

Degree Award in Reflective :: Reflexive Theory and Practice

Joint Hons. Running the Gauntlets in OverThinking

individual
|
INTERPERSONAL
: SCIENCES             
humanistic ------------------------------- mechanistic
SOCIOLOGY : POLITICAL   
|
group 
Photo: Peter Jones - Somerset House


See previous: 6th June 2010 - 'As one chapter closes another opens ...'

 
My source: Somerset House - 1st July 2026 M.C. Escher The Exhibition

Saturday, May 23, 2026

The alchemy of terminology, symbols, and signs ...

Or, 'What is a nurse doing … in a chemistry class?' [Ack. See Estrada]

In reading, I was reminded that chemistry adopted mathematical symbols for its own use. Not only that, but as a core science (with physics and biology, emerging from natural philosophy) there is a historical development from the time of alchemy:

Please see (with a graphical abstract):

C.Wentrup, The Transition from Alchemical to Modern Chemical Symbolism: from Bergman and Guiton de Morveau to Hassenfratz and Adet, Higgins, Richter, Dalton, and Berzelius. ChemPlusChem. 2024, 89, e202400033. https://doi.org/10.1002/cplu.202400033

This journey matters today as the use of symbols, in mathematics or other fields can be a barrier to learning and hence personal and disciplinary progress:

Ollie Hunter. Lost in translation: Demystify scientific symbolic language to help your chemistry students overcome any potential learning barriers. Royal Society of Chemistry, 23 May 2022.

As acknowledged many times, it is easy to take a word, or concept from one discipline and 'fit' it to - or in another. Or is it? Estrada concludes:

“The complexities of modern science and modern society have created a need for scientific generalists, for men trained in many fields of science.” This is a paradigm of science in the XXI century, where the advent of such fields like the study of complex systems requires multidisciplinary approaches. But the previous phrase was not written in the XXI century. It is the starting sentence in The education of a scientific generalist” published in Science in 1949 (Bode et al. 1949).' p.161. 

'Mathematics has been defined as the science of patterns. Thus, mathematicians search for “numerical patterns, patterns of shape, patterns of motion, patterns of behavior, voting patterns in a population, patterns of repeating chance events, and so on” (Byers 2010). Once a pattern is identified either in chemistry or in mathematics, the researcher can proceed to the clarification of the systematic rule which is behind that pattern. This is evident in the analogy used here between code-breaking and structure elucidation. This attachment to patterns makes both chemists and mathematicians very prone to the use of pictures. An organic chemist hardly can say anything about the chemical reactivity (or any physical or chemical property) of a molecule from its exact quantum-mechanical Hamiltonian. However, she will construct a complete narrative about the physical and chemical properties of a molecular structure drawn in a piece of paper, even if such a molecule is completely imagined. The power of pictures in mathematics is discussed in the book Mathematics and the Unexpected by Ivar Ekeland (1990) where its value is recognized as fundamental in the early stages of the development of mathematical ideas. This also introduces a very important analogy among chemists and mathematicians. Namely, that they use a proper language in their respective fields. While physicists use the mathematical language in their investigations, chemists use the sophisticated language of chemical formulas and specific symbols to represent charges, rearrangements, partial equilibria, etc. These “invented” languages mainly appear only in Chemistry and in Mathematics, making them unique intellectual activities.' p.162.

With thanks to the author, Ernesto Estrada IFISC for additional thoughts and insights:

Estrada, E. What is a mathematician doing…in a chemistry class?. Found Chem 26, 141–166 (2024). https://doi.org/10.1007/s10698-023-09497-4

Wednesday, April 22, 2026

ERCIM News No. 144 Special theme: "Advancing Open Science"


Dear ERCIM News reader,

ERCIM News 144 is now online [in PDF also]! This issue is dedicated to Advancing Open Science. Open Science is becoming an essential part of the European research landscape, shaping how knowledge, data, software, infrastructures and results are shared, reused and sustained.

The contributions collected in this special theme offer a cross-section insight into the current European effort to make research more open, transparent, collaborative and reusable.

This special theme was coordinated by our guest editors Leonardo Candela (CNR-ISTI) and Roberto Di Cosmo (Inria and University Paris Cité).

Includes: [PJ]

Rethinking Researcher Profiles in the Research Assessment Transition Era: The OpenAIRE Approach. pp.9-10.

P. Manghi, et al., “OpenAIRE Graph Dataset (10.6.0) [Data set]”, OpenAIRE.
https://doi.org/10.5281/zenodo.17725827

BibTexViz: Visualizing Research Productivity with Open Science Data. pp.10-12.

D. Hicks, et al., “The Leiden Manifesto for research metrics”, Nature 520, 429-431, 2015.
https://doi.org/10.1038/520429a
T. Munzner, “Visualization Analysis and Design”, CRC Press, 2014. https://doi.org/10.1201/b17511
M. Zaumanis, “Research Data Visualization and Scientific Graphics: For Papers, Presentations and Proposals”, Peer Recognized, 2021.

MOEBA-BIO: An Open and Extensible Framework for Evolutionary Biclustering in Biomedicine. pp.17-19.

Co-Creation as Infrastructure for Open Science Data Spaces. pp.24-25.

A Osterheider, et al., “Conceptualization of the Understanding of Participation and Co-Creation in Interdisciplinary Research Groups developing Digital Health Technology: An Exploratory Study: Conceptualization of the Understanding of Participation and Co-Creation”, Mensch und Computer 2023, 534–538, 2023. https://doi.org/10.1145/3603555.3608572

LICORICE: Deploying Privacy-Enhancing Technologies for Europe’s Digital Sovereignty. pp.30-31.

D4Science: An Enabling Infrastructure for Open Science. pp.38-39.

D. Schaap, M. Assante, et al., “Blue-Cloud: Exploring and demonstrating the potential of Open Science for ocean sustainability,” in Proc. 6th Int. Workshop on Metrology for the Sea; Learning to Measure Sea Health Parameters (MetroSea), IEEE, 2022, pp. 198–202, doi:10.1109/MetroSea55331.2022.9950819.

Next Issue - No. 145

Special Theme: E-values: Statistical Testing for the 21st Century

Call for Contributions

Thanks for reading ERCIM News. If you’ve enjoyed this issue, please feel free to forward it to colleagues who may find it interesting and help us reach even more readers by sharing it on LinkedIn.

If you’re considering an even deeper partnership, advertising in ERCIM News not only helps sustain our publication but also puts your message in front of an expert, highly qualified audience.

[ Posted from Marrakech 17th-27th April ] 

Friday, April 10, 2026

'Healing grid' - the penultimate?

Healing grid by Ryota Kanai

Hodges' model is surely a clear winner 'healing grid'? Acting not only in healing, but in recovery, rehabilitation, reablement, palliative, illness and well-being too.

Quite a grid all-in-all (which also fascinate grandchildren).

My source: 

Previously: 'grids' : 'perception' : 'vision' : 'lines' : 'geometry'

#ArtemisSafeReturn #PrecisionGridManoeuvres

Monday, September 29, 2025

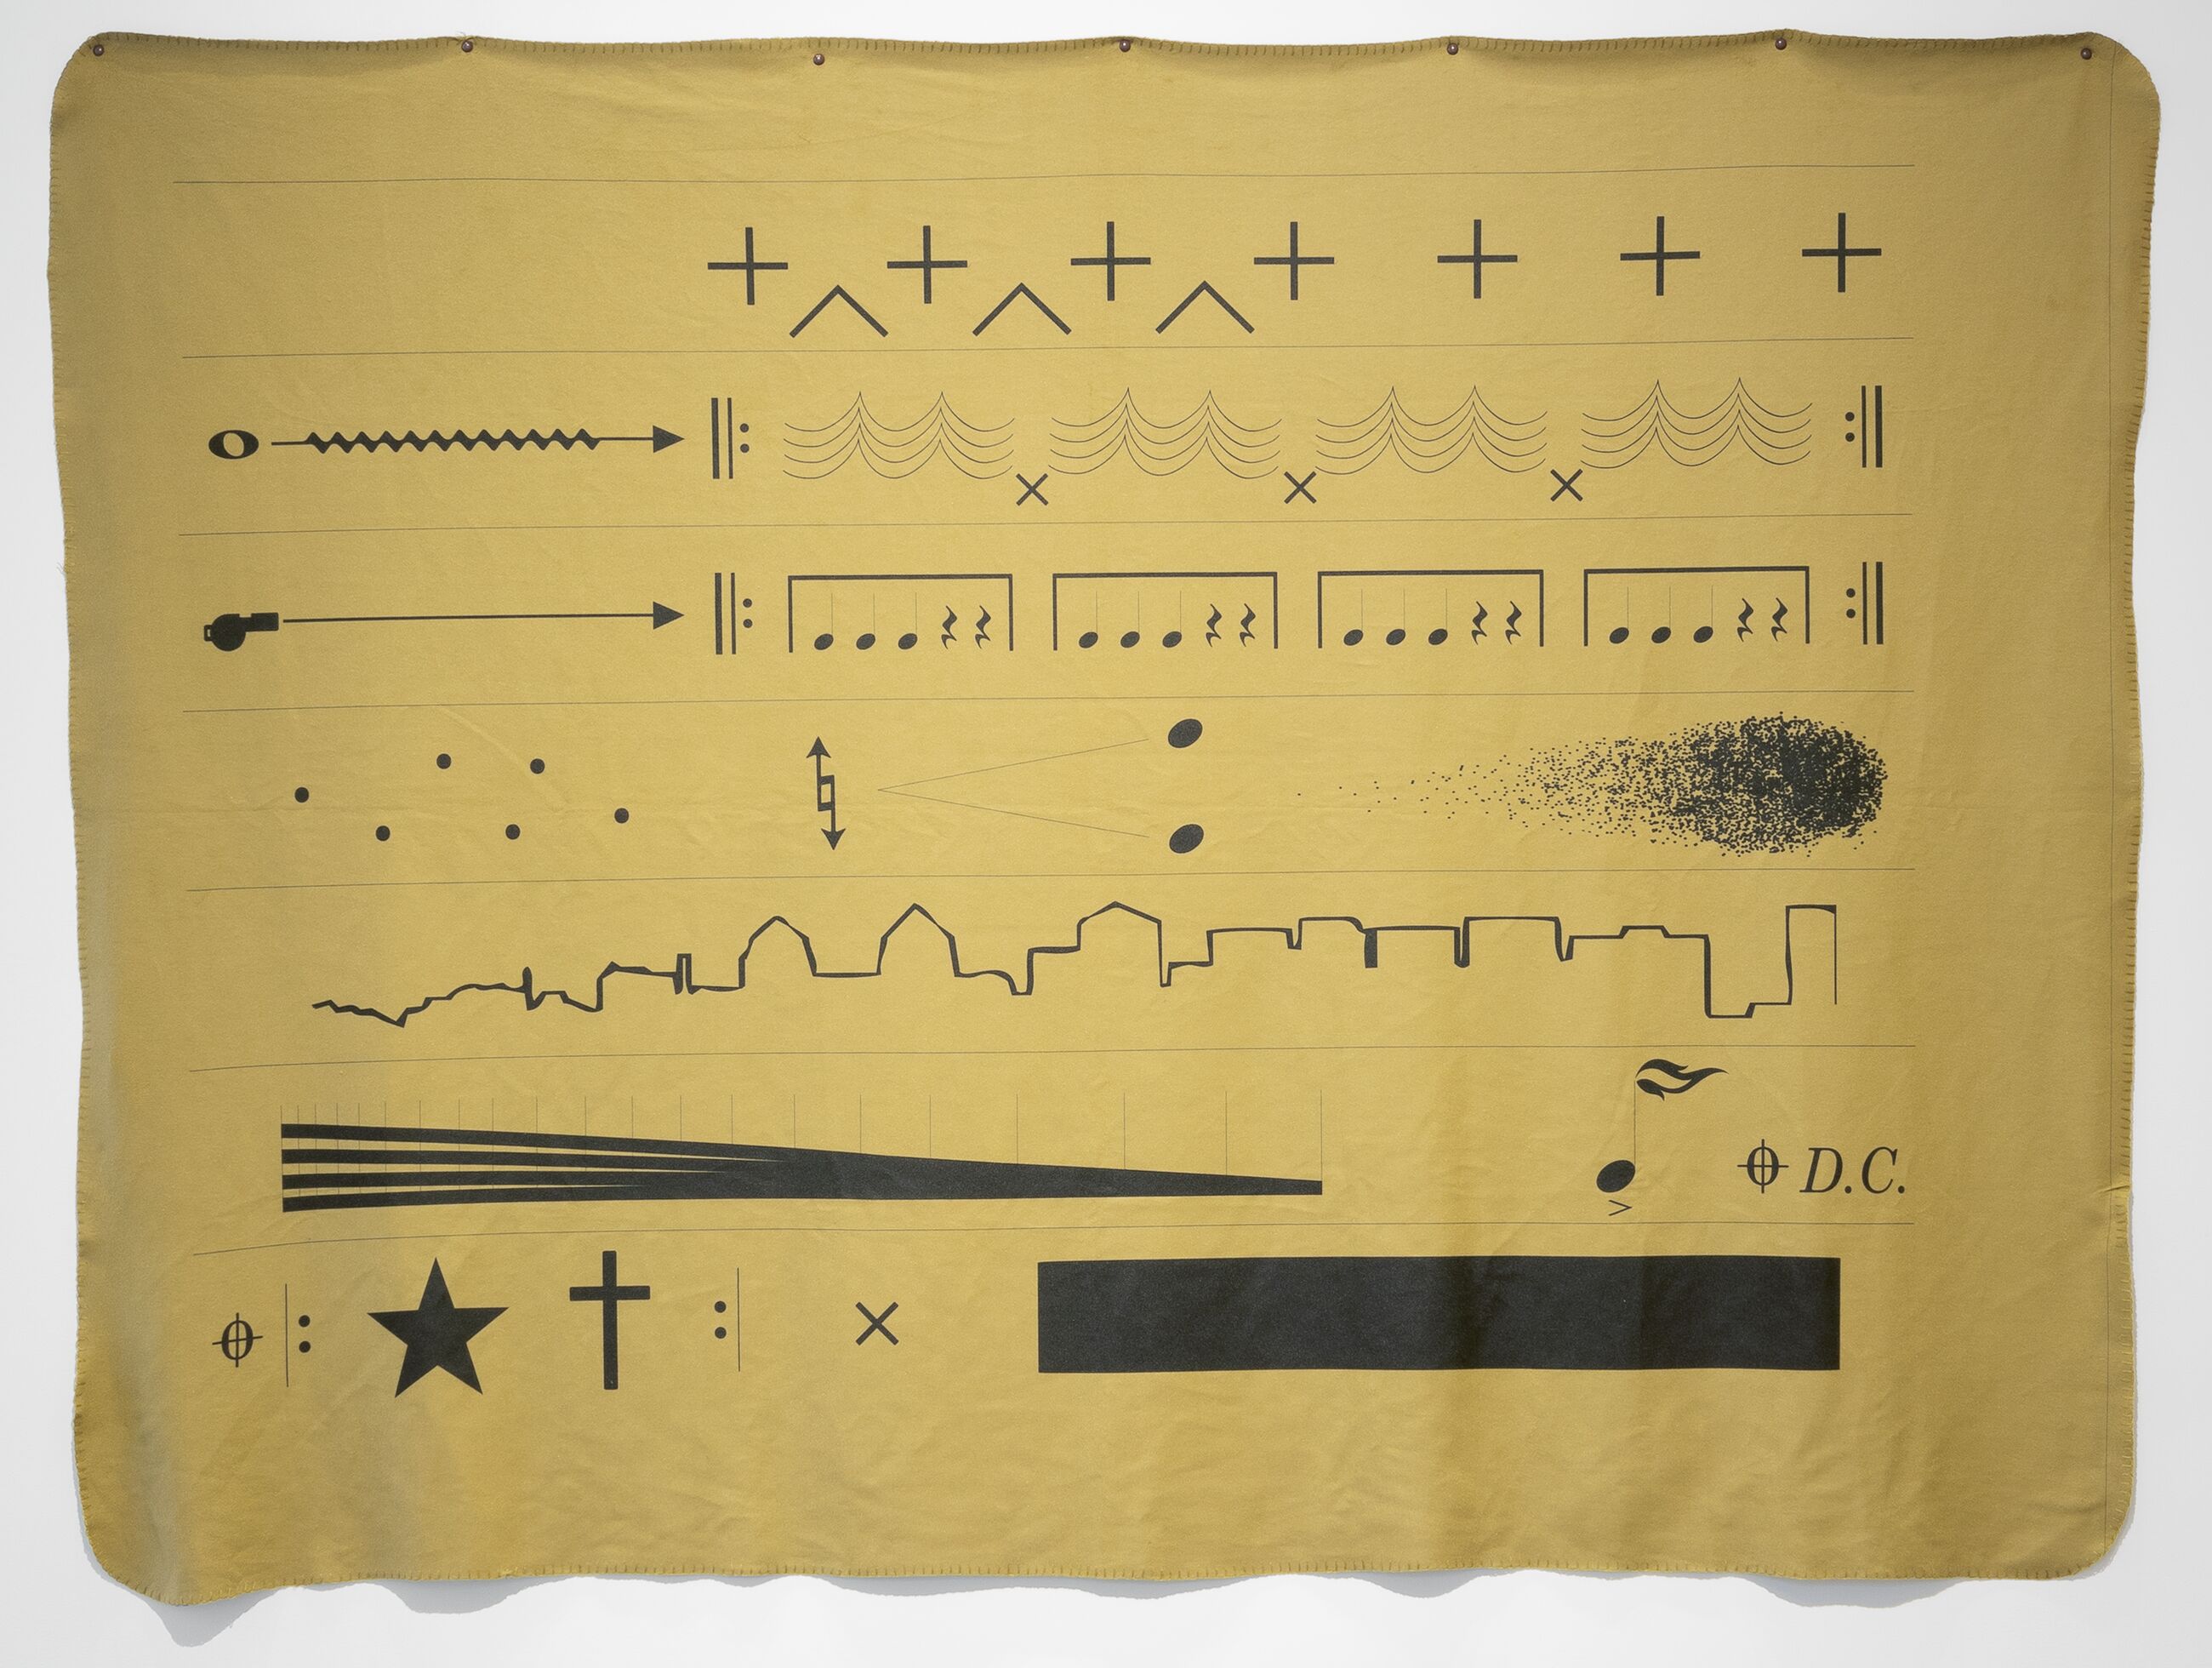
Raven Chacon - graphical musical scores

Individual
|
      INTERPERSONAL    :     SCIENCES               
HUMANISTIC  --------------------------------------  MECHANISTIC      
 SOCIOLOGY  :    POLITICAL 
|
Group
'The artist and composer Raven Chacon, 46, who grew up in Albuquerque and now divides his time between the city and upstate New York, used to explore these lava fields as a youngster, ingesting psychoactive plants such as jimson weed and searching for petroglyphs on the sides of rocks. Some - spirals, zigzags and dotted lines, for example - have found their way into the graphic musical scores for which he is now known. When I visited him in Albuquerque, he drove me out to see them.'
Raven Chacon, American Ledger No. 1 (Army Blanket), 2020. Graphic score


My source: Griffin, J. Sound of a different music. Life&Arts. FT Weekend. 24/25 February 2024. p.17.

Image: ECHOES OF A PLACE - Raven Chacon on transforming land, memory and political resistance into sound: https://www.hauserwirth.com/ursula/echoes-of-a-place-raven-chacon/

See also: RAVEN CHACON - https://spiderwebsinthesky.com/

https://en.wikipedia.org/wiki/Raven_Chacon

Previously: 'music'

Friday, September 26, 2025

Book: Atlas of Finance

Individual
|
      INTERPERSONAL    :     SCIENCES               
HUMANISTIC  --------------------------------------  MECHANISTIC      
 SOCIOLOGY  :    POLITICAL 
|


Dariusz Wójcik, James Cheshire, Oliver Uberti. (2024). Atlas of Finance: Mapping the Global Story of Money. Yale University Press. https://atlasoffinance.com/

Previously: 'atlas' : 'finance' : 'visualization'

My source:Guthrie, J. Tresure maps. Life& Arts. FT Weekend. 26/27 October 2024. p.12.

Sunday, January 29, 2023

Information design: Tufte & Raskin

Art & Science

Information Design  Edited by Robert Jacobson  Foreword by Richard Saul Wurman      $50.00 Paperback     Hardcover  373 pp., 8 x 9 in,      Paperback     9780262600354     Published: August 25, 2000     Publisher: The MIT Press
"Every major field of human activity is a mix of art and science. Theoretical physicists and professional mathematicians speak of the aesthetics of their work and are driven by concerns about elegance and beauty. Is a painter any less an artist for knowing perspective, understanding Josef Alber's elegant experiments and demonstrations about color, or being aware of chemical incompatibilities between various kinds of paint?

Designing the presentation of information, by the same token, partakes of the nature of both art and science. Edward Tufte's books reflect such a blend of knowledge. In one of them he outlines his five principles for designing graphics (1983: 105):" p.346.

[see below ...]
"The first four principles are (mostly) science-based. But the last, "revise and edit," tells us not only to check repeatedly that the first four conditions are met, but also apply our aesthetic judgement to the final work." p.347.
 INDIVIDUAL
|
  INTERPERSONAL    :     SCIENCES               
HUMANISTIC --------------------------------------  MECHANISTIC   
SOCIOLOGY  :   POLITICAL 
|
GROUP

5.revise and edit

  1. above all else show the data
  2. maximize the data-ink ratio
  3. erase non-data ink
  4. erase redundant data ink *

5.revise and edit

5.revise and edit

N.B. Take note of the potential significance of 'revise and edit' in the Political domain, and its consequences socially and personally (and spiritually within the 5th domain). 

*In terms of #5 revise and edit, and as I work to complete a draft paper on:

Reflecting Society, Technology, COVID19 and Information Disorder within Hodges' Model

- the ability to create and generate deep fakes using technology and generative AI, presents a major SOCIO-POLITICAL challenge. When public trust in media is fractured then everything can be denied - 'The Liar's Dividend' (Gregory, 2022).

Gregory, S. (2022). Deepfakes, misinformation and disinformation and authenticity infrastructure responses: Impacts on frontline witnessing, distant witnessing, and civic journalism. Journalism, 23(3), 708–729. https://doi.org/10.1177/14648849211060644

Raskin, J. (2000). Presenting Information. In R. Jacobson (Ed.), Information Design (pp. 341-348). Cambridge, MA: The MIT Press. 

See also: (The link below may time out, but 'Try again' works here.)

https://web.archive.org/web/20010710223205/http://www.jefraskin.com/forjef2/jefweb-compiled/published/NursingTheoryForSite.html

Thursday, August 25, 2022

Agile Visualization with Pharo: Normalizers

 INDIVIDUAL
|
 INTERPERSONAL    :     SCIENCES               
HUMANISTIC --------------------------------------  MECHANISTIC      
SOCIOLOGY  :   POLITICAL 
|
GROUP

shapes?


normalization
SHAPES


shapes?
normalization

shapes?


Agile Visualization
with Pharo

"Normalizers: Shapes may be shaped and colored in a meaningful way to represent attributes and properties of the objects represented by the shapes." p.49.


Bergel, A. (2022). Overview of Roassal. In: Agile Visualization with Pharo. Apress, Berkeley, CA. https://doi.org/10.1007/978-1-4842-7161-2_5

Tuesday, March 15, 2022

PhD Opportunity: An Atlas of Health and Social Inequalities


Excited to announce that we have funding for a +3 studentship in the UCL Department of Geography for the project “An Atlas of Health and Social Inequalities”. The research will be carried out in association with the Health Foundation and will comprise the creation of a range of innovative datasets presented through a series of ground-breaking maps and graphics. The project will centre on the Health Foundation’s Social and Economic Value of Health: Place programme, which is designed to generate new knowledge about the ways in which the physical and mental health of a population shapes their social and economic outcomes. The Health Foundation have funded a number of research projects already that focus on understanding the relationship between a given population’s health and the health of individuals within that population.

The PhD will benefit from insights from these projects and focus on the creation of a nationwide atlas to demonstrate the social and economic value of health. It will produce a series of research-led maps created from innovative and granular datasets to demonstrate the new ways that health data can be visualised. These will convey a range of variables including health metrics such as mortality, self-reported health, prevalence of specific health conditions, and social and economic outcomes including employment, pay, structural changes to industrial sector composition and social fragmentation.

The work will be supervised by myself (James.Cheshire AT ucl.ac.uk) and Dr Anwar Musah (a.musah AT ucl.ac.uk), to whom enquiries may be directed. The successful applicant will hold a First or Upper Second Class honours degree in a quantitative social science or computer science discipline and/or similar Masters qualification.

For further details on eligibility etc please see here.

CLICK HERE TO APPLY (Deadline 4th April)


My source: Spirit of 1848

Friday, April 30, 2021

Conference: Diagrams in Science, Science in Diagrams

Johannes Stabius, Astrolabium imperatorium: detail (Nuremberg: Johann Stuchs, 1515). Courtesy Bayerische Staatsbibliothek, Munich, Einbl. VIII, 12, broadside, 61 × 45 cm.

Diagrammatic forms of visualization are ubiquitous in scientific publications, as well as in popular mediations of scientific contents. Every computer interface relies on diagrammatic forms, combining textual and graphical elements. Diagrams abstract and encode information. They are indispensable in many scientific contexts, and, together with charts and graphs, also in the daily media, reaching a wide audience of experts and non-experts.


As natural and familiar as these abstract forms of representing information are to us, they are products of many historical developments. Their historical roots may go back to prehistoric epochs. However, the historical integration of diagrams in scientific contexts is relatively recent. Even if these developments with regard to Western cultures have their origin in antiquity and were significantly developed further in the sciences of the Middle Ages, the early modern period can be considered the first flourishing phase of the diagram in practically all areas of the sciences of that time.

This event proposes to trace this historical development in the early modern period. It takes a truly interdisciplinary approach when talking about a timespan of roughly 500 years (1300-1800) across all early modern sciences, from Architecture to Zodiac men in medicine. The talks bring together research on the culture of the diagram in various sciences of the epoch to form a large overall picture.

This event aims at tracing the emergences and the disruptions of traditions of diagrams in all fields of scientific theory and practice, e.g. (but not restricted to) geometry, astronomy, medicine, philosophy, alchemy, law, theology, and music.

It will address, among others, questions such as the following:


1. Do the diagrams under investigation come from a precise tradition or do they form the foundation of such a tradition?

2. What is the scientific/disciplinary context of the diagrams under investigation and how do they relate to it?

3. What is the aim of the diagrams under investigation (illustration, explanation, demonstration, etc.)?

4. How does the medium carrying diagrams under investigation impact their form and role (print, manuscript)?

5. What are the most intriguing visual/graphical features to be found in the diagrams under investigation?

6. How do the diagrams under investigation interact with the text and which vocabulary is used to refer to the diagrams?

7. What justifies the diagrams under investigation to be labelled as ‘diagrams’ (and not ‘tables’, ‘maps’, etc.) and what is a reasonable demarcation line here?

8. How do the diagrams under investigation relate to scientific practices (experiments, taking measures, etc.)?

More details:

https://www.biblhertz.it/3101937/conference-diagrams-in-science-science-in-diagrams.html

Monday, February 22, 2021

Call for Papers: Diagrams 2021


The organization of Diagrams 2021 is making rapid progress. Five outstanding Keynote speakers have now been announced. Also, the free, online conference has adopted a novel approach to the program structure that is expected to provide fair access to the conference across multiple time zones.

 Find more details in the 2nd call for papers attached below or on the webpage www.diagrams-conference.org/2021 - and do pass on the information if you know researchers or students for whom it may be relevant.

Best,

Mikkel Willum Johansen 

Publicity Chair

Diagrams 2021


*** Call for Papers: Diagrams 2021 ***

12th International Conference on the Theory and Application of Diagrams

September 28 – 30, 2021

Virtual Event

www.diagrams-conference.org/2021


*** Highlights ***


- FREE REGISTRATION

- Proceedings published by Springer

- Three Tracks: Main, Philosophy, and Psychology and Education.

- Graduate Symposium

- Best Paper and Best Student Paper awards

- Submission dates in April 2021.


***************** Keynote Speakers Announced *******************

Shaaron Ainsworth, University of Nottingham

Daniel Rosenberg, University of Oregon

Katarina Scheiter, University of Tubingen

Atsushi Shimojima, Doshisha University

Frederik Stjernfelt, Aalborg University of Copenhagen


Francesco Bellucci, University of Bologna, is the Inspirational ECR Speaker for Diagrams 2021

******************* Novel Program Schedule *********************

Diagrams 2021 will adopt a novel approach to scheduling talks, to accommodate different time zones across the globe. See

http://www.diagrams-conference.org/2021/index.php/program/

for more details.

*************************************************************

Diagrams is the only conference series that provides a united forum for all areas that are concerned with the study of diagrams and has a multidisciplinary emphasis.

For 2021, *MAIN TRACK* conference topics include, but are not limited to:

– applications of diagrams,
– computational models of reasoning with, and interpretation of, diagrams,
– design of diagrammatic notations,
– diagram understanding by humans or machines,
– diagram aesthetics and layout,– evaluation of diagrammatic notations,
– graphical communication and literacy,
– heterogeneous notations involving diagrams,
– history of diagrammatic notations,
– information visualization using diagrams,
– nature of diagrams and diagramming,
– novel technologies for diagram use,
– reasoning with diagrams,
– semiotics of diagrams,
– software to support the use of diagrams, and
– usability and human-computer interaction issues concerning diagrams.

In addition to the main track, Diagrams 2021 will have two further tracks: Philosophy, and Psychology and Education; for their topics of interest, see

http://www.diagrams-conference.org/2021/index.php/calls/main-track/

http://www.diagrams-conference.org/2021/index.php/calls/philosophy/

http://www.diagrams-conference.org/2021/index.php/calls/psychology-of-diagrams/.


If the main research contribution of your submission is considered to fit either of the other tracks then you are strongly encouraged to submit to the respective special track, each of which has a dedicated program committee.

Authors of accepted submissions will be expected to be in attendance at the virtual conference to present their research and respond to questions presented by delegates. All presenters must accept that it is not within the power of the organisers to prevent delegates from recording  talks. However, when registering, delegates will be asked to confirm that they will not record any part of the conference.

*****************************************************************

Submission Categories

The conference will include presentations of refereed Papers, Abstracts, and Posters, alongside a graduate symposium.

We invite submissions for peer review that focus on any aspect of diagrams research, as follows:

- Long Papers (16 pages),

- Abstracts (3 pages),

- Short Papers (8 pages),

- Posters (4 pages – this is both a maximum and minimum requirement).

More details and all important dates can be found on at www.diagrams-conference.org/2021.

*****************************************************************

________________________________

Mikkel Willum Johansen

Associate professor

Department of Science Education

University of Copenhagen

Wednesday, February 10, 2021

data-verse 1 by Ryoji Ikeda

INDIVIDUAL
|
INTERPERSONAL : SCIENCES
HUMANISTIC----------------------------------------------- MECHANISTIC
SOCIOLOGY : POLITICAL
|
GROUP - COMMUNITY - POPULATION


My source: Ings, S. Sublime numbers, FTWeekend, Life&Arts, 30 Nov-1 Dec 2019, p.15.

Friday, January 01, 2021

Mesmerized by the promise of 2021 ...

https://www.archimedes-lab.com/wp/2019/05/04/pascals-theorem/

 ... while listening to the New Year's Day Concert ...

HAPPY NEW YEAR TO ALL! 

BE SAFE, WELL

WISHES FOR HEALTH, PEACE & LOVE


Wednesday, April 22, 2020

Munker illusion: Finding a palette for holistic, person-centred care

Hodges' model - Integrated Care?

It is as obvious as black and white.

Health, social care & education
are bound to be siloed.

Get over it!

What do you want: a rich picture?

Color Assimilation Grid Illusion


"Only the grid is colorful, the rest of the video is in grayscale, but the lower resolution of our color perception makes the color assimilate/blend into the grayscale cells within the human visual system."
https://www.patreon.com/posts/color-grid-28734535
 
"I've found that the grid works best."  Øyvind Kolås

individual
|
INTERPERSONAL : SCIENCES
humanistic ----------------------------------------------- mechanistic
SOCIOLOGY : POLITICAL
|
group - population


#carearchitecture #careresolution #integratedcare

See for original post:
https://www.patreon.com/posts/color-grid-28734535

My source: Massimo

Sunday, April 14, 2019

Infographic: What does the UK spend on health and social care?

c/o John Appleby and BMJ


The political impact of this spending have huge ramifications for many individuals 
in terms of efficiency, effectiveness, equity and equality.

individual
|
INTERPERSONAL : SCIENCES
humanistic ----------------------------------------------- mechanistic
SOCIOLOGY : POLITICAL
|
group - population

Source:


Wednesday, April 03, 2019

Navigating Health and Social Care: We are on a mission - aren't we ...?*


"Before the introduction of instrument navigation, an aircraft pilot had to give up his mission whenever weather conditions worsened to a degree where visual orientation did not allow for secure landing at his destination airfield. This is situation of today's surgery." p.43.

Adams L, Krybus W, Meyer-Ebrecht D, Rüger D, Gilsbach JM, Mösges R, Schlöndorff G (1990)
Computer assisted surgery. IEEE Computer Graphics and Applications. 10:43–51.

*All together.

Thursday, July 12, 2018

Yes, Nursing is both an Art and Science but ...

... we don't want facsimile care


individual
|
INTERPERSONAL : SCIENCES
humanistic -- NURSING AS ART & SCIENCE -- mechanistic
SOCIOLOGY : POLITICAL
|
group


iterate, iterate
process, process
repeat, repeat
recurse

Pedro Paricio - 'The Duel'
Halcyon Gallery, 1 July 2018


See also:

Pedro Paricio
[Dear Sir, Thank you for your amazing work and to Halcyon Gallery for the opportunity to view and photograph the above. Just a suggestion - the text on your site e.g. 'biography' is small and not very readable against the background.]

BBC News: NHS still reliant on 'archaic' fax machines

Friday, March 30, 2018

When a Double-Page Spread is not Enough ...

individual
|
INTERPERSONAL : SCIENCES
humanistic ---------------- the HEALTH RECORD --------------- mechanistic
SOCIOLOGY : POLITICAL
|
group

VA ".. how important is the notion of the book or the page to your research and outcomes?"

AGV "They are fundamental to my research.


I explore the double-page spread as a material support and a discursive space for visual ideas within an exhibition context. ...


The double-page spread is for me an extended space, a place to develop a site-specific practice.


... My intention is to generate meaning through symbolic signification, enhancing its material qualities through mirroring, folds, reflections and echoes."


Source: In Conversation, PRINTMAKING TODAY, Spring 2018, Cello Press Ltd. Volume 27, No. 1 Issue 105, p.4. Victoria Ahrens talks to Altea Grau Vidal about her PhD research and the format of the double-page spread as an opening for all her work.

Monday, January 08, 2018

Scratching the surface: Optimization algorithms

... In healthcare ..? 
Well - yes,
we've definitely scratched the surface,
but not a sufficient number of surfaces,
and not necessarily the right ones 
in the right order...

individual
|
INTERPERSONAL : SCIENCES
humanistic --------------------------------------- mechanistic
SOCIOLOGY : POLITICAL
|
group

http://ruder.io/optimizing-gradient-descent/index.html#gradientdescentvariants


My source: