Hodges' Model: Welcome to the QUAD: graphs

Hodges' model is a conceptual framework to support reflection and critical thinking. Situated, the model can help integrate all disciplines (academic and professional). Amid news items, are posts that illustrate the scope and application of the model. A bibliography and A4 template are provided in the sidebar. Welcome to the QUAD ...

Showing posts with label graphs. Show all posts

Friday, March 20, 2026

Florence Nightingale Commemoration Service

Supporting nurses and midwives to promote health, improve care and save lives Florence Nightingale Commemoration Service

The second group of public tickets for the Florence Nightingale Commemoration Service will be available at 13:00 GMT on 24 March. Click the button below as soon as possible after this time, to complete the form to apply. 

You will be able to request a maximum of 2 tickets and you will need to complete the form with your name and email address. If you are requesting two tickets you will also need to give the name and email address of the second person. 

Please note that if you provide guest details they will then receive an email with an invitation and will need to RSVP themselves in order to secure their ticket. 

If you have further queries please visit our Frequently Asked Question page.

🔷

INDIVIDUAL
|
    INTERPERSONAL    :     SCIENCES               
HUMANISTIC --------------------------------------  MECHANISTIC      
SOCIOLOGY  :   POLITICAL 
|
GROUP
On Wednesday in Waterstones, Deansgate, Manchester, I spotted this book. Opening it randomly - I kid you not - it fell to pp.204-205, and Florence Nightingale's contribution.


'At that time, the idea of visualizing data in order to make its messages clearer to non-mathematicians (including politicians) in order to change minds and inform opinions had started to gain traction in Europe but was not common in England. Nightingale continued to use statistical diagrams to communicate stories hidden in data, and while this clearly contributed to improvements in health and mortality in British military encampments at home and abroad (and by extension in the population in general), it is also undoubtedly the case that she helped to popularize the use of appropriate data visualization methods to expand the reach of statistical information beyond specialist audiences. A testament to the influence of her work is that the Royal Statistical Society had the honour of accepting Florence Nightingale as their first female member in 1859.' p.204.


Thomas K. Briggs. (2025) The Mathematicians' Library The books that unlocked the power of numbers Hardback. Part of the Libri Historici series. Ivy Press.
 
Previously: 'Nightingale' : 'math' 

My source: Waterstone, Deansgate, Manchester and email Florence Nightingale Foundation.

Friday, January 30, 2026

ERCIM News No. 143 Special theme: "AI for Science"

 
Dear ERCIM News reader,

ERCIM News 143 is now online! The articles in this special theme show that AI is no longer a peripheral tool in science, but a central part of research practice across disciplines. AI for Science is reshaping how research is organised, understood, and conducted, while also raising important questions about trust, transparency, energy use, and the evolving role of human expertise.

Read the January 2026 Issue


This issue in PDF


This special theme was coordinated by our guest editors Edina Nemeth (SZTAKI) and Alexandre Termier (University of Rennes – Inria/IRISA).


My source:
Peter Kunz ERCIM https://www.ercim.eu https://ercim-news.ercim.eu

Wednesday, January 28, 2026

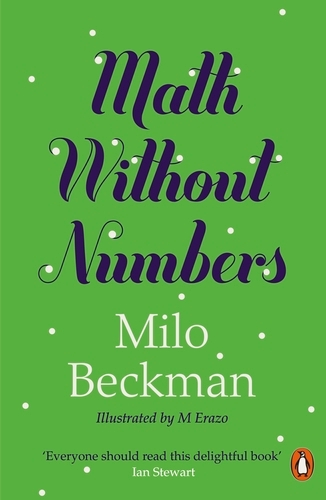
ii Math Without Numbers - final notes & obs

In Math Without Numbers the chapters and topics flow and slot in really well, even for novices. There is no index, the inclusion of which is a first-check usually. The book's appeal was its non-technical title and invitation reading the sleeve notes. The title throws up words and visuals, the latter, to repeat, are ably and simply furnished by M Erazo. Remaining notes to highlight (record here) include (and capture overthinking!):

Math Without Numbers

Reference to 'ideology space', 'conceptual space' and the role of visual analogies, idioms, and how 'the list of spaces to choose from is always the same.' ... pp.28 & 29. On page 30, 'When you say that gender is a spectrum rather than a binary, that's a topological claim: You're  saying gender space is one-dimensional (a line) rather than zero-dimensional (two separate points). 'Questions about which conceptual paradigm to use sometimes boil down to questions of dimensionality.' Discussion of an infinite continuum had me making an axis of Hodges' model warp, this way and that: concave-convex (p.59). Maps and correspondence is already well established, as per a new paper (abstract and thanks to follow 1st Feb):

S. Bettiol, P. Jones, H. A. Onyedikachi, and W. G. Kernohan, “Bridging Gaps in Oral Health Frameworks: Mapping With Hodges' Health Career - Care Domains - Model”, Journal of Public Health Dentistry (2026): 1–14, https://doi.org/10.1111/jphd.70034 

Interesting to read of general map facts, flowing substances inside a rigid container, and vector maps. A pencilled note to share:

'Because when you look at things in the abstract like this, dusting off the specifics of a situation to focus on underlying dynamics, you start to realize there are only so many different patterns and structures out there. These patterns and structures are called mathematical objects, and thinking about them is called math.' p.79

The chapter on (generalised) Algebra, forced me to reconsider the Socratic, guided discovery and arrival at the structure of Hodges' model. (lines & points : nodes & edges). For page 88, I noted 'generic' invites abstraction. Isomorphism is discussed. Again I tested this against Hodges' model. I've always found it helps to immerse oneself in a new vocabulary: so welcome (anew) - structures, fields, rings, groups, loops, graphs, lattices, orderings, semigroups, groupoids, monoids, magmas, modules . . . algebras, p.101. Some are named only, but on graphs raises questions ... p.103.

'How densely interconnected is it? How segregated into different cliques? Does it cut clean into two subgraphs, with no connections between them? Can it be drawn without any lines crossing? Are there any lone dots without any connections?' 

There's the matter of 'friend of a friend' who have broken out of the sociological domain. Other notes to self: Significance of concepts - patient-centred, service-centred? The distance between between (vertical, horizontal, diametric)? There are weighted graphs (p. 104) and acknowledgement of category theory (p.115). A chapter on modelling pp.161-175, and models p.164 & p.169 are just a selection of highlights on a marvellous tour.

A hidden puzzle in the book remains a mystery for me.

Milo Beckman (2021) Math Without Numbers. London, Penguin Books. Illustrated by M. Erazo.

Previously: 'math' : 'diagrams' 
Plus, now archived Science domain links: 
https://web.archive.org/web/20150414125339/http://www.p-jones.demon.co.uk/linksTwo.htm

Believe it or not, this 'diversion' does help my reading of Order and the Virtual. 

Sunday, December 21, 2025

Disciplinary bridges ... how's your sense of direction?

As an advocate for Hodges' model, I've acquired an affinity for inter- multi- transdisciplinary bridges, especially medical sociology, those leading towards the mathematical, and human geography. An old but significant influence is:

Chapman, K. (1979). People, pattern, and process: an introduction to human geography. London: Edward Arnold.

Chapman begins with the concept of distance, speed of movement and the consequence of the shrinking world. Our ability to move faster has radically altered the total travel time: from what was a 50 mile walking-day. In chapter 2, 'A Conceptual Framework' refers to:

  • Decision making - the basic mechanism
    • The Spatial Context
    • The Content of Space
  • Dimensions of Space
  • Spatial Process - Causality in Time and Space

Overall, the book also takes me back to a paper I cited in 2007: Bell jars and bell curves

I'm sure the 'School of Geography' at Leeds is unrecognisable today from that of the 1980s. But the referenced paper in the 'Bell jars..' post:

Macgill, S.M. (1984). Structural Analysis of Social Data, A Guide to Ho's Galois Lattice Approach and A Partial Re-Specification of QAnalysis, Working Paper 416, School of Geography, University of Leeds. Abstract 1985

- still gives me an itch I can't scratch. 

 I could not fully understand, or follow, the print quality doesn't help, but it captured my imagination (perhaps that is enough?).

Chapter 9 stands out with 'Spatial Pattern' pp.203-234, 9.1.1 Topologic Structures, pp.205-209. Here, Chapman explains and has examples of connectivity matrices, with three indices to calculate the connectivity in a graph. All grist for the mill.

Happy Solstice too!

Friday, December 27, 2024

Living document - "Semantic Web: Past, Present, and Future"

Dear Semantic Web community

As the year ends, the question remains: How will the Semantic Web look in 2025?

Together with Katja Hose, Maria-Esther Vidal, Gerd Groener, and Petr Škoda, we contributed this year an article titled "Semantic Web: Past, Present, and Future", see

https://drops.dagstuhl.de/entities/document/10.4230/TGDK.2.1.3 to the new Diamond Open Access journal on Transactions on Graph Data and Knowledge (TGDK, https://tgdk.org/). This primer has been a living document for 13 years; see the link for details!

As many of us cannot resist checking emails over the break, I ask you to consider the question:
What is our future in 2025?

Many "classical" Semantic Web researchers have witnessed the rise of Linked Open Data, Freebase being bought by Google (largely seen as a big win), and the beginning and success of the Knowledge Graph era. Many of us have moved on to or added topics like graph representation learning, graph neural networks, language models, etc., to our research portfolio. So, how much of the classical topics are left? How much will come back? Should we work more on knowledge graph embeddings obeying OWL axioms? Shall we have federated queries not only over multiple data sources but also include hybrid queries using similarities in graph embeddings?

In the current 2024 version of the primer, we include the latest W3C standards developed by the Semantic Web community. But we also explain the journey from the famous Linked Data principles via Knowledge Graphs to the hot topic of machine learning on graphs!

*The article linked above is an invitation to contribute. Contact me if you are interested!* 

It will be updated from time to time. We like to receive your feedback, and perhaps you would like to contribute to a future version.

Best wishes and happy holidays,

Ansgar

PS: For 2025, there is a plan to update the German version of the article in an introductory textbook on artificial intelligence. It will add Shallow Graph Embeddings, Graph Neural Networks, and the interplay of Knowledge Graphs and Language Models. Once ready, I plan to ping this back to the English version.

My source:
Ansgar Scherp
From:mail AT ansgarscherp.net
To:semantic-web AT w3.org
4.3   3-12
'Domain Ontologies represent knowledge specific to a particular domain [48, 109]. Domain ontologies are used as external sources of background knowledge [48]. They can be built on foundational ontologies [110] or core ontologies [131], which provide precise structuring to the domain ontology and thus improve interoperability between different domain ontologies. Domain ontologies can be simple such as the FOAF ontology or the event ontology mentioned above, or very complex and extensive, having been developed by domain experts, such as the SNOMED medical ontology.' ...

3-13

'Foundational Ontologies have a very wide scope and can be reused in a wide variety of modeling scenarios [24]. They are therefore used for reference purposes [109] and aim to model the most general and generic concepts and relations that can be used to describe almost any aspect of our world [24, 109], such as objects and events. An example is the Descriptive Ontology for Linguistic and Cognitive Engineering (DOLCE) [24]. Such basic ontologies have a rich axiomatization that is important at the developmental stage of ontologies. They help ontology engineers to have a formal and internally consistent conceptualization of the world, which can be modeled and checked for consistency. For the use of foundational ontologies in a concrete application, i.e., during the runtime of an application, the rich axiomatization can often be removed and replaced by a more lightweight version of the foundational ontology.
 In contrast, domain ontologies are built specifically to allow automatic reasoning at runtime. Therefore, when designing and developing ontologies, completeness and complexity on the one hand must always be balanced with the efficiency of reasoning mechanisms on the other. In order to represent structured knowledge, such as the scenario depicted in Figure 1, interconnected ontologies are needed, which are spanned in a network over the Internet. For this purpose, the ontologies used must match and be aligned with each other.'
Health - See also 4.2 (A post in 2025 ...re. SKOS?).

Wednesday, February 10, 2021

data-verse 1 by Ryoji Ikeda

INDIVIDUAL
|
INTERPERSONAL : SCIENCES
HUMANISTIC----------------------------------------------- MECHANISTIC
SOCIOLOGY : POLITICAL
|
GROUP - COMMUNITY - POPULATION


My source: Ings, S. Sublime numbers, FTWeekend, Life&Arts, 30 Nov-1 Dec 2019, p.15.

Sunday, September 22, 2019

c/o JAN: Formal Concept Analysis ... and an encouraging footnote

My source:


Andersson, N, Silver, H. Fuzzy cognitive mapping: An old tool with new uses in nursing research. J Adv Nurs. 2019; 00: 1– 8. https://doi.org/10.1111/jan.14192

This tweet prompted a reply and further reflection, as I've been aware of FCA for quite a while. A math disability (but remote fascination?) precludes me really 'getting to grips' with this. As noted before on W2tQ, visualization in the humanities (social sciences) has still not realised its potential. Those researchers, professional workers ... who could benefit from its application, being in the 'humanities', often do not understand the underlying mathematics. Even though they are not necessarily that advanced (sixth-form - undergraduate?).

Over the years I have built up a small library of related papers and books. The Macgill (1984) paper referenced below, I started to 'read' and work through and got a short way. The print quality is rather poor and obviously dated, but that is not the problem. I will try again. Since the 1980s software has changed beyond the proprietary packages of MathCad, MathLab, Maple and Mathematica and collectively they should (must?) make these methods more accessible. Of course, I thought this with regards to the use of content management system for a website (yes, that one!). Again though it's not the tools, but my choice, time and focus.

I write this and it might only be intuition, but I'm not just sure, I know there is something here.

Seeing FCA in JAN's tweet I thought of a certain footnote even though on my copy the reference seems incomplete:

Kwong, C. P. A Topological Framework for Formal Concept Analysis, The Chinese University of Hong Kong.

On the first page the footnote reads:

"The adjective "formal" is used to emphasize the mathematical substance of the objects being studied, which may be left out when such a formality is superfluous."

As you can imagine this is quite a gift for me. In a way it suggests the following from a 2x2 matrix with keywords (concepts), to an arbitrary array:

individual
|
INTERPERSONAL : SCIENCES
humanistic ----------------------------------------------- mechanistic
SOCIOLOGY : POLITICAL
|
group - population

1001
1110
0001
1111

1101
0100
1010
0011

1111
0011
0011
0110

0110
1111
0000
0110

There is a worry here. When your formative nurse education and training stressed the need to shift from a task-oriented approach to individualised, then filling the domains of Hodges' model with '1's and '0's is a bona fide task-checklist - even if a binary one.

There is a response to that concern for another post; but before that there is another source c/o:

Johana Ramírez Gaviria (2015) Aspectos topológicos en el Análisis deConceptos FormalesTopological aspects in Formal Concept Analysis, Universidad Nacional de Colombia Facultad de Ciencias Exactas y Naturales Departamento de Matemáticas y Estadística Manizales, Colombia. p.6.
c/o Google, Spanish – detected, English
En [26] se plantean nuevos modelos para el FCA usando nociones de la topología algebraica. El contexto formal convencional es reemplazado por una matriz con entradas ”1” ó ”0” denominada matriz contexto, para construir una familia simplicial (familia concepto), de ahi se desprenden propiedades que relacionan la teoría de la topología algebraica con el FCA.

Cabe resaltar que hasta el momento no se ha trabajado en dotar de estructura topológica los contextos formales en el FCA generalizado, donde los datos de las tablas toman valores difusos en lugar de valores binarios como se tiene para el FCA clásico.
In [26] new models for the FCA are proposed using notions of the topology algebraic The conventional formal context is replaced by a matrix with “1” or "0" called context matrix, to build a simplicial family (concept family), from there properties that relate the theory of algebraic topology with the FCA.

It should be noted that so far no work has been done to provide a topological structure the formal contexts in the generalized FCA, where the data in the tables take values diffuse instead of binary values ​​as you have for the classic FCA. 
[26, reference is Kwong]
  The whole thesis would need translating, but I have a sense that this too is useful.

Working through papers, files, journals, books getting rid of, sorting, re-filing ... I'll see if I can add to the reading below.

Atkin, R. (1974). Mathematical Structure in Human Affairs. London, Heinemann.

Macgill, S.M. (1984). Structural Analysis of Social Data, A Guide to Ho's Galois Lattice Approach and A Partial Re-Specification of QAnalysis, Working Paper 416, School of Geography, University of Leeds.

Previous post:
Bell jars and bell curves


Thanks to @jadvnursing for this tweet in-particular and for RTs.
(Paper e-copy received with thanks c/o Neil Andersson, 25 Oct 2019.).

Thursday, April 29, 2010

A paper by Anzures-Cabrera & Higgins, Graphical displays for meta-analysis: An overview with suggestions for practice

The interesting paper below is currently available online:

Graphical displays for meta-analysis: An overview with suggestions for practice,
Judith Anzures-Cabrera, Julian P. T. Higgins

Keywords: meta-analysis • graphical displays • forest plot • funnel plot • Galbraith plot • L'Abbe plot

Abstract:

Meta-analyses are fundamental tools for collating and synthesizing large amounts of information, and graphical displays have become the principal tool for presenting the results of multiple studies of the same research question. We review standard and proposed graphical displays for presentation of meta-analytic data, and offer our recommendations on how they might be presented to provide the most useful and user-friendly illustrations. We concentrate on graphs that specifically aim to present similar sorts of univariate results from multiple studies. We start with forest plots and funnel plots, and proceed to Galbraith (or radial) plots, L'Abbé (and related) plots, further plots useful for investigating heterogeneity, plots useful for model diagnostics and plots for illustrating likelihoods and Bayesian meta-analyses.

Judith Anzures-Cabrera, Julian P. T. Higgins (2010) Graphical displays for meta-analysis: An overview with suggestions for practice, Research Synthesis Methods, 1, 1, 66-80.
DOI: 10.1002/jrsm.6

<->

I will explore these plot / diagram forms and update the diagrams listing on Links II accordingly. I wonder if this journal (or another?) will re-visit the question of visualization methods in the humanities - social sciences?