Hodges' Model: Welcome to the QUAD: Search results for diagrams

Hodges' model is a conceptual framework to support reflection and critical thinking. Situated, the model can help integrate all disciplines (academic and professional). Amid news items, are posts that illustrate the scope and application of the model. A bibliography and A4 template are provided in the sidebar. Welcome to the QUAD ...

Showing posts sorted by relevance for query diagrams. Sort by date Show all posts

Monday, February 22, 2021

Call for Papers: Diagrams 2021


The organization of Diagrams 2021 is making rapid progress. Five outstanding Keynote speakers have now been announced. Also, the free, online conference has adopted a novel approach to the program structure that is expected to provide fair access to the conference across multiple time zones.

 Find more details in the 2nd call for papers attached below or on the webpage www.diagrams-conference.org/2021 - and do pass on the information if you know researchers or students for whom it may be relevant.

Best,

Mikkel Willum Johansen 

Publicity Chair

Diagrams 2021


*** Call for Papers: Diagrams 2021 ***

12th International Conference on the Theory and Application of Diagrams

September 28 – 30, 2021

Virtual Event

www.diagrams-conference.org/2021


*** Highlights ***


- FREE REGISTRATION

- Proceedings published by Springer

- Three Tracks: Main, Philosophy, and Psychology and Education.

- Graduate Symposium

- Best Paper and Best Student Paper awards

- Submission dates in April 2021.


***************** Keynote Speakers Announced *******************

Shaaron Ainsworth, University of Nottingham

Daniel Rosenberg, University of Oregon

Katarina Scheiter, University of Tubingen

Atsushi Shimojima, Doshisha University

Frederik Stjernfelt, Aalborg University of Copenhagen


Francesco Bellucci, University of Bologna, is the Inspirational ECR Speaker for Diagrams 2021

******************* Novel Program Schedule *********************

Diagrams 2021 will adopt a novel approach to scheduling talks, to accommodate different time zones across the globe. See

http://www.diagrams-conference.org/2021/index.php/program/

for more details.

*************************************************************

Diagrams is the only conference series that provides a united forum for all areas that are concerned with the study of diagrams and has a multidisciplinary emphasis.

For 2021, *MAIN TRACK* conference topics include, but are not limited to:

– applications of diagrams,
– computational models of reasoning with, and interpretation of, diagrams,
– design of diagrammatic notations,
– diagram understanding by humans or machines,
– diagram aesthetics and layout,– evaluation of diagrammatic notations,
– graphical communication and literacy,
– heterogeneous notations involving diagrams,
– history of diagrammatic notations,
– information visualization using diagrams,
– nature of diagrams and diagramming,
– novel technologies for diagram use,
– reasoning with diagrams,
– semiotics of diagrams,
– software to support the use of diagrams, and
– usability and human-computer interaction issues concerning diagrams.

In addition to the main track, Diagrams 2021 will have two further tracks: Philosophy, and Psychology and Education; for their topics of interest, see

http://www.diagrams-conference.org/2021/index.php/calls/main-track/

http://www.diagrams-conference.org/2021/index.php/calls/philosophy/

http://www.diagrams-conference.org/2021/index.php/calls/psychology-of-diagrams/.


If the main research contribution of your submission is considered to fit either of the other tracks then you are strongly encouraged to submit to the respective special track, each of which has a dedicated program committee.

Authors of accepted submissions will be expected to be in attendance at the virtual conference to present their research and respond to questions presented by delegates. All presenters must accept that it is not within the power of the organisers to prevent delegates from recording  talks. However, when registering, delegates will be asked to confirm that they will not record any part of the conference.

*****************************************************************

Submission Categories

The conference will include presentations of refereed Papers, Abstracts, and Posters, alongside a graduate symposium.

We invite submissions for peer review that focus on any aspect of diagrams research, as follows:

- Long Papers (16 pages),

- Abstracts (3 pages),

- Short Papers (8 pages),

- Posters (4 pages – this is both a maximum and minimum requirement).

More details and all important dates can be found on at www.diagrams-conference.org/2021.

*****************************************************************

________________________________

Mikkel Willum Johansen

Associate professor

Department of Science Education

University of Copenhagen
Friday, April 30, 2021

Conference: Diagrams in Science, Science in Diagrams

Johannes Stabius, Astrolabium imperatorium: detail (Nuremberg: Johann Stuchs, 1515). Courtesy Bayerische Staatsbibliothek, Munich, Einbl. VIII, 12, broadside, 61 × 45 cm.

Diagrammatic forms of visualization are ubiquitous in scientific publications, as well as in popular mediations of scientific contents. Every computer interface relies on diagrammatic forms, combining textual and graphical elements. Diagrams abstract and encode information. They are indispensable in many scientific contexts, and, together with charts and graphs, also in the daily media, reaching a wide audience of experts and non-experts.


As natural and familiar as these abstract forms of representing information are to us, they are products of many historical developments. Their historical roots may go back to prehistoric epochs. However, the historical integration of diagrams in scientific contexts is relatively recent. Even if these developments with regard to Western cultures have their origin in antiquity and were significantly developed further in the sciences of the Middle Ages, the early modern period can be considered the first flourishing phase of the diagram in practically all areas of the sciences of that time.

This event proposes to trace this historical development in the early modern period. It takes a truly interdisciplinary approach when talking about a timespan of roughly 500 years (1300-1800) across all early modern sciences, from Architecture to Zodiac men in medicine. The talks bring together research on the culture of the diagram in various sciences of the epoch to form a large overall picture.

This event aims at tracing the emergences and the disruptions of traditions of diagrams in all fields of scientific theory and practice, e.g. (but not restricted to) geometry, astronomy, medicine, philosophy, alchemy, law, theology, and music.

It will address, among others, questions such as the following:


1. Do the diagrams under investigation come from a precise tradition or do they form the foundation of such a tradition?

2. What is the scientific/disciplinary context of the diagrams under investigation and how do they relate to it?

3. What is the aim of the diagrams under investigation (illustration, explanation, demonstration, etc.)?

4. How does the medium carrying diagrams under investigation impact their form and role (print, manuscript)?

5. What are the most intriguing visual/graphical features to be found in the diagrams under investigation?

6. How do the diagrams under investigation interact with the text and which vocabulary is used to refer to the diagrams?

7. What justifies the diagrams under investigation to be labelled as ‘diagrams’ (and not ‘tables’, ‘maps’, etc.) and what is a reasonable demarcation line here?

8. How do the diagrams under investigation relate to scientific practices (experiments, taking measures, etc.)?

More details:

https://www.biblhertz.it/3101937/conference-diagrams-in-science-science-in-diagrams.html

Friday, July 04, 2025

Diagrams - AMO/OMA at Prada Foundation Venice

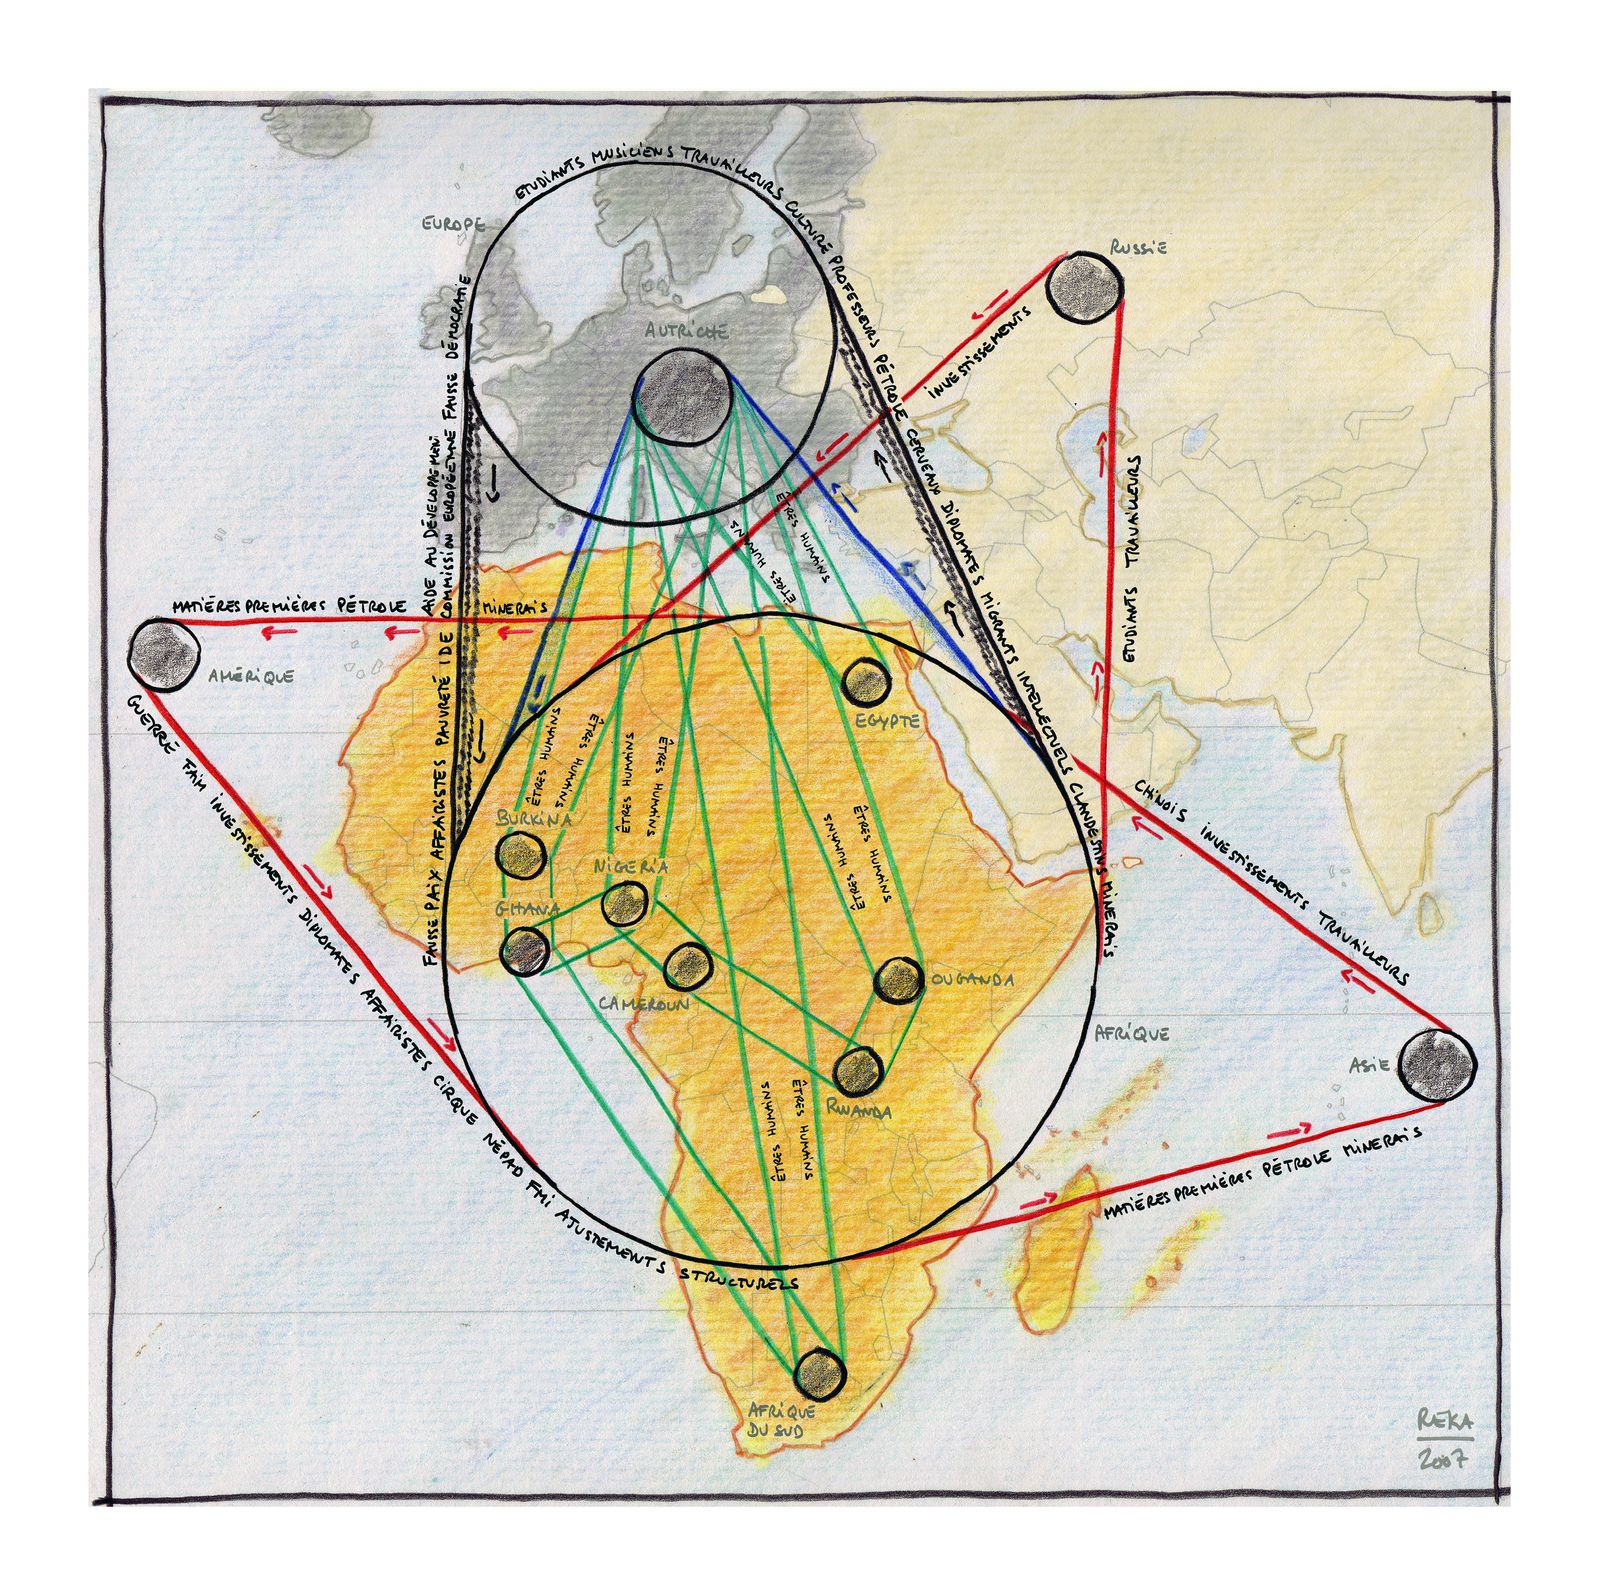
"There is no such thing as an innocent map, observes Philippe Rekacewicz in his catalogue essay that accompanies Diagrams, a new exhibition at the Prada Foundation in Venice.

A renowned cartographer, the Paris-born Rekacewicz is well aware of his medium's capacity to transform narratives for good and ill. His own work includes maps that illustrate the deaths of migrants as they bid for new lives in Europe. "A map," Rekacewicz continues, "is above all a social and political act - and therefore inherently subjective."' p.5.

Individual
|
      INTERPERSONAL    :     SCIENCES               
HUMANISTIC  --------------------------------------  MECHANISTIC      
 SOCIOLOGY  :    POLITICAL 
|
Group
Am I Free?

My history ...
Philippe Rekacewicz / The African big wheel, 2007
The wheel symbolizes permanence and continuity in the context of a profoundly unequal exchange, drawing, color pencil and ink, exhibition copy.
Courtesy Philippe Rekacewicz
(Image credit: Philippe Rekacewicz)

SOCIETY

... is our history ...

Freedom

National & International Law

Justice


'Other pictures are equally revealing for what they conceal. Consider the diagram entitled "Universal commercial history", a visual analysis drawn up by the Scottish engineer William Playfair in 1805 which traces the rise and fall of global wealth since 1500 BC against what he terms "Remarkable Events Relative to Commerce". Playfair, who is said to have invented the pie chart, includes moments such as "Rome founded" "Mahomet's Flight" and "America discovered". He never mentions slavery.

With such a broad-brush approach, lacunae are inevitable. It is a shame that the work of Viennese social scientist Otto Neurath - who, along with his wife Marie and colleague Gerd Arntz, invented the Isotype (International System of Typographic Picture Education) - is not on show. Based on pictograms, Neurath's Isotypes are an lmportant forerunner to the digital vernacular (from emojis to icons) so familiar to us today. Nor does the exhibition include maps of the devastation of Gaza since October 2023, such as those made by investigative research agency Forensic Architecture, which are proving among the most critical diagrams of our time.' p.5.

Philippe Rekacewicz - https://www.grida.no/resources/10988

My source:
Rachel Spence. Hidden truths in the best laid plans. Diagrams | What charts, maps and graphics can - and can't - tell us. Collecting, FTWeekend. 26-27 April 2025. p.5. 
With many thanks acknowledging length of quotation.

Image source:
https://www.wallpaper.com/architecture/oma-amo-diagrams-prada-foundation-venice

See also: 'icon' : 'symbols' : 'diagram' : 'map' : 'Forensic Architecture'

Archived listing Links II Sciences - inc. 'Diagrams' & 'Visualization I' and 'II': 

Tuesday, August 25, 2026

Medicine - Mathematics & History

'We now come to the input of mathematics into medical history, and to the related questions of arithmetic and quantification, ratio and proportion, geometrical argument and diagrams, and probability. Mathematics (consisting in arithmetic, geometry, astrology and music) had an established place in the quadrivium of the medieval arts course; its application to medicine is demonstrated in such textbooks as the Articella, which include treatises on weights and measures, and in studies of proportion and ratio such as those of the medieval Oxford calculators which Italian doctors among others caused to be revived at the beginning of our period. In the sixteenth century, it was a vigorously debated subject; there is a well-documented discussion of the certainty of mathematics, concerning its status in respect to the logical adequacy of its proofs, in which some natural philosophers and doctors (notably Cardano) take part. It will come therefore as no surprise that it was prescribed for doctors by most Renaissance pedagogical writers;  this prescription is often specifically linked to Galen's geometrical (axiomatic) method whose operations are the constitution of objects from elements, the comparison of existing objects and their reduction into their constitutive elements.

Associated with mathematics are diagrams, that is, abstract quantified spatial representations. There is a modern debate about the contribution of technical innovations in illustration in the Renaissance (most notably perspective) to the scientific revolution: this is only relevant here insofar as some participants in this debate argue for the importance of diagrammatic symbolisation of mental abstractions above those, like perspective, which are still representations of the real world, and see the former as a step on the path to full algebraic notation of geometry. Not all Renaissance thinkers were persuaded of their usefulness: Argenterio describes the diagrams of Manardo and Akakia reproduced below as 'vain and false tables and figures'; but I shall argue here that they were related to the uptake of doctors from the arts course insofar as well-known logical diagrams reproduced above (4.3:3) were adapted by them for their own purposes.' pp.171-172.

Maclean, Ian. 2002. Chapter 5, Beyond logic: geometry, proportion, quantity. In Logic, Signs, and Nature in the Renaissance: The Case of Learned Medicine. Cambridge/New York: Cambridge University Press.

Related to ongoing reading, Maclean provides two (among several) historical illustrations (with apologies for the quality) on pp.174-175, the first is from the Wellcome Collection:

Dubois, Jacques, 1478-1555 (Boe͏̈, Jacques, Bois, J. d., Boë, J., del, Boë, J., Del Boë, J., DelBoe͏̈, J., . . . Sylvius/de Bois). (1548). Methodus sex librorum galeni in differentiis et causis morborum et symptomatum in tabellas sex ordine suo conjecta paulo fusius ne brevitas obscura lectorem remoretur & fallat. de signis omnibus medicis, hoc est salubribus, insalubribus, & neutris, commentarius / ... per jacobum sylvium ..Paris: Retrieved from https://www.proquest.com/books/methodus-sex-librorum-galeni-differentiis-et/docview/2090356749/se-2

Jacobus Sylvius, 1539

Which Maclean then translates / interprets (p.174):

Maclean. Figure 5.1, p.174.

'Manardo goes further, and causes and symptoms adapts the square of contraries to represent not only all the possible combinations of temperaments (combinations of cold and hot and wet and dry are cleverly excluded) but also inserts a mediate point to represent the absolutely temperate body: see fig. 5.2.
This adaptation of the square of contraries (which has precedents in the medieval period) shows the appropriation for their own use by doctors of the logical instruments at their disposal.

As we have seen, it is a feature of medical thinking to take into account many circumstantiae or variables, and, over time, the numbers of variables taken into consideration increases.' p.174-175.

Figure 5.2 Giovanni Manardo, p.175.

individual
|
INTERPERSONAL
: SCIENCES             
humanistic ------------------------------- mechanistic
SOCIOLOGY : POLITICAL   
|
group

quality

logic

quantity
past - present - future
diagrams

symptoms - signs


subjective

objective

Previously: 'medicine' : 'history' : 'diagram'

Wednesday, November 17, 2010

The Beauty of Diagrams: Vitruvian Man BBC Four

Tomorrow a new six part series begins on BBC Four.

Diagrams, conceptual frameworks and cognitive spaces have driven my interest in models of care and h2cm for decades:

1996 Peter attends 'Thinking with Diagrams' Colloquium, IEE, Savoy Place, London. 18 Jan BCS-SGES et al.
Professional Group C4: Digest No: 96/010


I also maintain a 'diagrams' listing on the sciences domain listing, suggestions welcome.

So, really looking forward to this!

Sunday, September 16, 2007

SCIENCES links: Holistic Bliss or Tristram Shandy ... V

Finally: what of the content of the SCIENCES links page? Firstly, a little background -

Hodges' model has a key role to play in engagement. In health this means helping people to help themselves. Assist them to use the knowledge and experience they have of their illnesses. When necessary educate them - patients, carers and the general public. Use the latest research to further health promotion and preventive measures. These efforts, these messages though must compete with an awful cacophony of noise - political and cultural in the media - that is frequently itself awful dross.

Little wonder then that the science, educational and political communities are so concerned about the public switch-off, with citizens ill-equipped to critique and engage in debate on key SCIENCE issues - biotechnology, nanotech, astronautics - funding!

Engagement is not for everyone of course, but surely we can do better this?

Over on this right-hand MECHANISTIC side of h2cm what should political expectations (aspirations!) be regards the holistic bandwidth of a given citizenry? What does the 21st C. curriculum for the citizen look like? Is it as taught, the written, the learned, DIY, the 'take away', the media delivered or the hidden, ...?

Back to the task at hand: Like all the links pages SCIENCES also places health related subjects uppermost for ready access together with selected conferences. Not surprisingly ANATOMY & PHYS are first on the top row, followed by selected NURSING AND CARE THEORIES. If the h2cm website has any roots as a project it started here and spread.

The media in general and IT commentators in particular stress information overload. The relentless increase in the volume of information year-on-year has a prime contributor amongst the research community in medicine.

When we speak of General Practitioner (family physician) it seems increasingly difficult to determine what is general? There are so many branches of medicine even before specialised directions must be taken. The costs and risks associated with 21st C. medicine mean that filtering the research literature to find the treatment pearls is crucial to effective practice, outcomes, management and policy. So, EVIDENCE BASED PRACTICE (EBP) that utilises e-libraries and electronic databases is the tool of our times and with QUANTITATIVE RESEARCH completes the top row.

Before moving down a peg (if digression sensitive turn away now).

If you look at Hodges' model and its quadrants with a nurse's eye, you know for intramuscular injections the dorsogluteal - the upper-outer quadrant of the buttock - has been cited as a preferred site. How fitting then that the upper-right quadrant in h2cm is the SCIENCES. Problem is of course upper-outer translates as upper-right AND upper-left and sticking needles in people is a pretty invasive and mechanistic task. That upper-outer LEFT quadrant in h2cm translates to the humanistic [INTERPERSONAL] domain, so sticking needles there may be anatomically correct, but epistemologically speaking where are the talking therapies? (The model also at this point invites dialogue and debate on addiction.)

Recently, I've been researching a paper on socio-technical structures (which will also attempt to explain the hyphen), this project-making or -breaking conjunction of the social and technical for me begs the question of the locus of INFORMATICS. There are many schools of informatics in addition to HEALTH INFORMATICS I & II. If it is sensible to ask of these informatics fields, which h2cm domains would they claim as their primary home? [COMMUNITY INFORMATICS is listed in the political domain.] The great and ongoing efforts in CLINICAL CODING AND CLASSIFICATION within medicine are also listed here.

I've often wondered about how much duplication there is in the various electronic databases that are available? What metrics would you use? There's a major Phd study for someone there if not already completed or under way? We see rationalisation in other industries, business sectors until then (or the semantic web) the plethora of available resources in INFO SOURCES further extends EBP. In artificial intelligence pruning the search is an essential strategy. Is the internet tree still growing or shrinking? I understand it is actually shrinking - rationalisation has begun?

The next three categories represent a key personal interest of mine. IMHO graphics, diagrams and visualization can help conjoin health, informatics, h2cm and the wider world; hence DIAGRAMS and VISUALIZATION I & II. Is there a role for DIAGRAMmatic reasoning in health and social care?

It could be argued (and has been) that visual literacy is yet another educational milestone.

PROGRAMMING is great fun - if you are not concerned with hydraulic control systems, air traffic control software, or clinical systems. MARKUP LANGUAGES variations of XML have proved revolutionary. In reading about and my initial tinkering with Drupal, XML is in there (and so much more). In education and nursing theory much is written about the need to bridge the theory-practice gap. Perhaps the gap is necessary: a velodrome has to have a centre. XML is a software technology that can bridge gaps in transforming data, information and knowledge.

As in other domains I wondered where to place ENVIRONMENT & ECOLOGY? In the four introductions to the website, I've stressed the relationship (dependency) between green issues, health and our quality of life. ENVIRONMENT & ECOLOGY should ideally reside in each of the domains, or at the centre the 5th domain - the spiritual - made up of all four.

Our VIRTUAL creations and worlds are presented next. IF you want to conjoin data sources, users, and present information & engage users, THEN use the senses that are available. Health and social care records can benefit from visualization as tantalisingly glimpsed in early work on visualization in the social sciences. (I'll see if I can switch these around a bit.)

Next: ASTRONOMY: Orion - you started this journey from my bedroom window. Rising in Winter standing tall then giving way to Spring. We need to give the real stars back to the people:

Turn off the light,
take a deep breath and relax
[Engima - Mea Culpa]

SCIENCE could comprise so much more space permitting just one scratch of this surface - pharmacology, chemistry, physics the new disciplines all deserve listings of their own.

SCIENCE is most clearly evinced in MATHS & LOGIC that provide the basis for ENGINEERING. The final two categories return to programming. Compared with the others this final row is smaller. I have to contain this pantological journey. The H2CM links pages are big enough: I know my limits.

The final category RUBY [TOOLSET] is perhaps poetic justice since programming is oft described as SCIENCE and ART. One thing that Hodges' model is about -

folding time and space.

Sunday, October 06, 2024

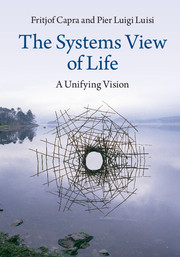
[v] Book: The Systems View of Life - A Unifying Vision

The Systems View of Life -
A Unifying Vision


Part IV begins with the ecological dimensions of life. There's a reminder that ecology, comes from the Greek 'oikos' for "household". We need this -

move you rubbish (don't leave it in the first place), wipe your feet; switch the lights off when not in use, assuming you have them!; close and open the windows as needed; think less 'location, location, location' and having a home.

Given the pictorial form of Hodges' model - mind-mapping - I've always been attracted to diagrams, no-less here the pioneering work of the Odum brothers and 'Odum flow diagrams' which even today are an ecological currency in the literature (p.344-45). An update on ecosystems as dissipative structures and as autopoietic would be helpful. Of course, now for scholars and students have search terms then resources and learning can follow. While ozone depletion is acknowledged, the role of the atmosphere could possibly be (briefly) expanded (guest essay, box?), in-particular the role of the Van Allen belts and the fact of Earth's magnetic field and (still) molten core. 16.2.3 definitely points the way pp.348-351.

16.3.1 Defining sustainability - made me sit up. Lester Brown's 1980's work is not referenced in:

Jones P, Wirnitzer K. Hodges’ model: the Sustainable Development Goals and public health – universal health coverage demands a universal framework. BMJ Nutrition, Prevention & Health 2022;5:doi: 10.1136/bmjnph-2021-000254 (From the bibliography listing in the sidebar of this blog.)
It was Brown who defined sustainability, and the question is ongoing regards how to build a sustainable society (p.352). Key as Capra 2002 notes is that a sustainable human community would not interfere with nature's inherent ability to sustain life. Ecological literacy 16.3.2 was also welcome; a constant theme on this blog, given the many claimed forms of literacy, as with (schools of) informatics. The informational perspective can reveal its power across literacies and informatics, consider media and information literacy? A way to paraphrase the authors: "The market and the marketplace is information disordered." (p.354).

Three chapters include descriptions of agencies (with links) that work with knowledge in an interdisciplinary way; where ecological and spiritual dimensions of education are emphasized; and in chapter 18 several other centers of learning. Chapter 16 looks at organisations with a focus on ecoliteracy in schools, colleges and universities. Checking some of the links many are ongoing - alive!
Struck in the past by the original approach of Goethe to 'science', his work on patterns is described in the introduction and here in relation to the arts and curricula. You will find 'art' sprinkled throughout the posts on W2tQ. Key concepts are described networks, flows, cycles, nested systems, dynamic balance, and development. Chapter 17 joins the dots of the world's problems. 'Growth' appears a disposable term, in how it is applied and so little understood, even by politicians and policy makers? Recent UK politics is a prime example. There is a another concurrent thread (to informatics and literacy) on this blog, as it is inbuilt, hard and soft-wired into the structure of Hodges' model. It is dichotomy, polarity and oppositions, specifically, objective - subjective, quality - quantity.
'In fact, the new systemic conception of life makes it possible to formulate a scientific concept of quality. It seems that there are two different meanings of the term - one objective and the other subjective. In the objective sense, the qualities of a complex system refer to properties of the system that none of its parts exhibit. Quantities like mass or energy tell us about the properties of the parts, and their sum total is equal to the corresponding property of the whole - e.g., the total mass or energy. Qualities like stress or health, by contrast, cannot be expressed as the sum of properties of the parts. Qualities arise from processes and patterns of relationships among the parts. Hence, we cannot understand the nature of complex systems such as organisms, ecosystems, societies, and economies if we try to describe them in purely quantitative terms. Quantities can be measured; qualities need to be mapped (see Section 4.3).
With the recent emphasis on complexity, networks, and patterns of organization, the attention of scientists in the life sciences has begun to shift from quantities to qualities, and there has been a corresponding conceptual shift in mathematics. In fact, this began in physics during the 1960s with the strong emphasis on symmetry (see Section 8.4,3), which is a quality, and it intensified during the subsequent decades with the development of complexity theory, or nonlinear dynamics, which is a mathematics of patterns and relationships. The strange attractors of chaos theory and the fractals of fractal geometry are visual patterns representing the qualities of complex systems (see Sections 6.3 and 6.4). 

In the human realm, the notion of quality always seems to include references to human experiences, which are subjective aspects. This should not be surprising. Since all qualities arise from processes and patterns of relationships, they will necessarily include subjective elements if these processes and relationships involve human beings.' pp.368-369. (My emphasis - and encouraging for research and researchers in Hodges' model)
The authors point out how the conjoining of 'sustainable development' is problematic when viewed in qualitative and quantitative terms (17.2.2 pp.369-371). I wonder what Capra and Luis would make of the SDGs and the metrics employed today? This has been an issue (reading for Jones & Wirnitzer, 2022), with measures needing to catch up and the disruption of COVID. There really is a case for economic literacy for people globally, as 'freedom' is so readily passed-off - associated with economics and trade as a 'right'. Another potential update revolves around globalisation, what would they make of Doughnut economics?

An additional risk now are the bitcoin factories and energy needed to drive AI data-processing. How transparent are global corporations in declaring their energy use? The LIBOR scandal is raised, but what the cost involved in Bankman-Fried and FTX-Alameda Research fraud? Capitalism is built on speculation and always will be? But if we defer 'paying' for economic transformation in a decade the costs will rapidly increase. Capra and Luis acknowledge the need to think about future generations. An ethical stance that is, thankfully, changing policy, and deserves attention.

I pencilled in the margin - what is the conclusion of the lesson of Argentina? Do the economists, the IMF, the World Bank, the Argentinian people know? What of the economic predilections of other nations? Who are the exemplars, the pioneers? Must Africa follow the West's bad-habits? Can they leap-frog technologies (land-lines, fossil fuel reliance ...)? I understand they are! In the West, do we need to re-invent public information services, to address the prevailing mindset? Even as the financial industry has passed-through a 'quant' phase, but mathematics still (and will always) hold sway (p.379).

Page 381 reminded me of the need for gainful employment, and how this is threatened and has always been threatened by technology (very broadly defined). The varied forms of parity of esteem become evident not just in health (mental - physical); education (technical - vocational), but employment too, especially with automation and artificial intelligence. The decade since the book was published leaves room for new content: what might replace or complement The Occupy Movement, The Seattle Coalition? The socio-political rate of change is remarkable. Greta Thunberg and Extinction Rebellion, for example, are clearly post-publication. The claimed rationale for business as usual in 'trickle down economics' remains relevant (sadly) p.384. More could be made now of the two numbers - 565 gigatons and 2,800 gigatons of carbon (350.org); and the current debate on carbon capture (Ah! p.408). 

I have over the years associated the intra- interpersonal domain with the individual's cognition, reasoning, logic, intellect, thought, and education. Collectively though we need to invert this:

individual
|
INTERPERSONAL : SCIENCES
humanistic ------------------------------- mechanistic
SOCIOLOGY : POLITICAL
|
group
education
EDUCATION

EDUCATION
EDUCATION


It is essential for every person to be informed were possible, to get to this situation (e.g. this book in a sense is an appeal for the public's understanding of science; and our political leaders):


individual
|
INTERPERSONAL : SCIENCES
humanistic ------------------------------- mechanistic
SOCIOLOGY : POLITICAL
|
group
EDUCATION
EDUCATION

EDUCATION
ANOTHER WORLD
IS POSSIBLE!


Chapter 18 pulls everything together (and provides HOPE) in systemic solutions. The previous post:

- drew on this chapter (p.398). I didn't realise 'commercial speech' is protected in the USA. 

As expected - a moral compass is still needed (p.430). I really the section on acroecology. It might be an idea to read this final chapter first. If there is a response to the question (there's no answer) as to why we are here - this is it. Biotech has its section, genetic engineering, the scope and risks, as does, the third industrial revolution, citing Rifkin's five pillars (2011). Agribusiness, world hunger, and the twelve myths:

'At a time of unprecedented wealth, when almost one-half of all Americans own stocks and are able to watch their wealth and economic power grow on the nightly news, it is good to remember that over 800 million people worldwide are passing the same nights unable to feed themselves and their children. A full quarter of other Americans, especially children, have much in common with the world’s hungry, experiencing their own hunger intermittently. Frances Moore Lappe and co-authors Joseph Collins and Peter Rosset in World Hunger: 12 Myths are there to remind us. Remind us of the plight of the world’s hungry, as Frances Moore Lappe has done for over 20 years, and remind us too that there is enough food; that hunger is not necessary; that hunger is a social creation; hungry people a social phenomenon, and consequently one that depends on us and that we can change.'

https://www.worldhunger.org/world-hunger-12-myths/ 

The chapter and book closes with a meditation regards hope. A comprehensive bibliography and index follows.

Despite the age of this book it has proved well-worth reading. I am glad I pursued my original request for a review copy. Well recommended and I wonder if there would be another edition? Clearly this would take a great effort, but then needs must? I will revisit the chapter on health. In the past week, the  the UK's last coal power plant closed (BBC News). Change is happening. And the weather globally of recent months cannot be denied. 

My thanks are extended to the team at Cambridge University Press for the paperback copy.

Fritjof Capra and Pier Luigi Luisi (2014) The Systems View of Life - A Unifying Vision. Cambridge: Cambridge University Press.

https://www.cambridge.org/gb/universitypress/subjects/life-sciences/genomics-bioinformatics-and-systems-biology/systems-view-life-unifying-vision?format=HB&isbn=9781107011366


Saturday, March 09, 2019

ii) A map as well as an app...? - c/o John Kulvicki

"Maps are picture-language hybrids." p.149.

"The features covering maps are like lexemes of a language that play a predicative role." p.149.

"Maps are pictorial in their use of space." p.149.

"Maps, pictures, and diagrams differ from language not in whether
they make use of predication, but in the way they organize predicates.
In maps, predicates are introduced holistically, in groups, as degrees of
freedom to which any location on a map must commit.
This proposal constitutes a different way of understanding the
coarse-grained distinction between maps, pictures, and diagrams
on the one hand, and linguistic representations on the other." p.150.


"In maps, failing to indicate the presence of something—a town, a river, a road, or an island—is tantamount to indicating its absence." p.150.

Kulvicki, John, Maps, Pictures, and Predication, Ergo, Volume 2, No. 07, 2015

Saturday, October 13, 2018

Book Review: [iv] Health System Redesign - Part 3 & 4

Part 3 tackles the structure and dynamics of health system organisations. The introduction begins with how we perceive whole and part and teases out levels once again. These have their own concepts and language as we move through layers. This transition between layers means we also have to dispense with, or suspend the detail that a layer gives us - the 'cellular level' for example. Sturmberg describes the properties of layered systems that include, concepts, discovery, interaction and constraints. As is often the case through the book, table 1 (chapter 9) captures a great deal with figure 3 - health system phenomena and different levels of organisation. The final addendum of part 2 posed the questions: what to change?; what to change to?; and, how to cause the change (p.158)? This introduction reminds us of the constant need to consider parts (data) anbd the joining of wholes (wisdom).

Chapter 9 is about modelling, potentially a dense and jargon-ridden subject, but the treatment here retains the book's accessibility, clarity and interest. This chapter is like an answer to a soapbox of mine as it highlights the role and use of spatial modelling and geographic information tools. Admittedly, as clinicians (all disciplines) we cannot be service planners and public (mental) health specialists, but services should have access to such tools. (Teams could have a running list of 3 research questions that can be taken up, revised by students and team members, perhaps allied to CPD and other training/education commitments). Sturmberg gives us: mental health services in Helsinki; childhood obesity in Berlin; Life expectancy in a city and infection risk in Democratic Republic of Congo.

On first picking up the book, the arrangement of the parts with an introduction and the chapter introductions can be a little confusing. But the disorientation is brief. The book has some typos: 'intense' for 'intents' p.171; 'locking' for 'looking' p.179; 'build' for 'built' p.225; 'pleural' for 'plural' p.234; outlined, p.251. (I used to read papers for data definition standards.)

This does not detract from something special in 9.3 modelling system problems. The question is "What ... if..? and a series of scenarios in aged community care: What if -

  • We double the number of nursing home beds?
  • We double the social care workforce?
  • We combine a 50% increase in both the above?
The addenda for chapter 9 are system diagrams and link to chapter 10 very nicely returning to micro, meso and macro levels. I could sketch out the multiple cause and sign graph diagram fig 10.1 for a patient and how deteriorating health results as much from the interdependent variables of his social context as basic physiology (p.197 - another case study).

With a book that can serve as a key reference for Hodges' model - it had to happen (sorry!). Here I have mapped some of the content of Table 10.1 (p.209) to h2cm:
individual
|
INTERPERSONAL : SCIENCES
humanistic ----------------------------------------------- mechanistic
SOCIOLOGY : POLITICAL
|
group
Mental Health
Hip replacement surgery
Flu vaccination
Multimorbidity management of polypharmacy
Intensive Care Unit
Managing a second degree burn
Protocols - handwashing -
Community care for frail elderly
Managing a natural disaster (social impact)
- policy
Health financing
Nurse unit manager ensuring staff record every patient incident regardless how trivial
Surgeon managing theatre team
Acute psychiatric Unit
Bed management of a hospital
(*see below)

This week driving between my community visits, a radio public health notice asked listeners: what is the 2nd most significant cause of cancer after smoking? It begins with 'O' and ends with 'Y'. Chapter 11 concerns obesity at the personal, personal-community, and community-whole society levels. This chapter relies on diagrams-figures, some are difficult to read and with no web reference to go to the detail is lost (figure 11.10). The message is not lost, however; a magnifying glass might help (figure 11.8). 'Obesity' must include the industrial and political dimensions.* 'Food sovereignty' is an important point (p.223). If blockchain technology does prove itself beyond cryptocurrencies could it find an governing application in food system regulation?

Sturmberg anticipates there is/will be resistance and refers to the need:

"to overcome some of the false and unhelpful conceptual dichotomies in the debate about the obesity epidemic"p.227.

What follows then is a need for informed debate and argumentation?

Part IV brings to life the book's subtitle and achieving this goal: Chapter 12 how things ought to be. The introduction here is rich - 6 pages, 16 references mainly tables but informative.

Personomics p.246 is a gift to me and unsurprisingly it is allied with person-centredness. Sturmberg rightly stresses how we need to put the person at the centre of the system. Although referred to constantly - to the point of rhetoric? in the literature, politicval media. In Hodges' model I have stressed how 'work' is involved in achieving person-centredness and being person-centred. In the model the individual needs to 'moved' conceptually, in the first instance to the centre of the model.

With figure 12.2 I'm still sore from the back-flip. I've possibly seen this before, but the version on p.249 is again very meaningful and vital to holistic and integrated care.

https://www.storybasedstrategy.org/the4thbox


I would switch this slightly for h2cm, thus:


EQUITY :: EQUALITY


REALITY :: LIBERATION

The book ends on design and design thinking. H2cm leads inevitably to structure and content and as such care architecture and so design. Here the book is talking 'problem solving strategies' and hence Health System Redesign. Such ambition needs to attend to barriers and once again in 13.4 we consider "what might stand in the way". Even at the end Sturmberg is clarifying and extending definitions: Adam Smith - the Public Good AND the free market; 'social' and 'socialised'. This is not an oversight but helps close a fascinating circle and excellent book.


The 'blurb' as they say refers to the book as a "forward-looking volume" - together with the knowledge here - and crucially the combined wisdom that results - we can make it here-and-now.

I would like to express my many thanks to Prof. Sturmberg and Springer for the review copy.

Sturmberg JP. Health System Redesign. How to Make Health Care Person-Centered, Equitable, and Sustainable. Cham, Switzerland: Springer; 2018.

See also:

Book Review: [i]

Book Review: [ii]

Book Review: [iii]

Sunday, May 31, 2020

Book Review: ii Mathematics and Art: A Cultural History

Last time I suggested that philosophy is missing from the title. Architecture is another very welcome theme in the book, the significance of perspective to art being obvious, but not the only focus. As mentioned the preface is an invitation to dive in. The oldest star atlas (xi), Chinese, sets the scientific and global tone to follow. My interest in diagrams, was quickly awoken as there are many in this book. I recalled the lunar cycle depicted on cave walls and bone. The first diagrams from prehistory. The preface works brilliantly as an introduction, such that I couldn't wait for chapter 7: "Scientists describe such symmetries using the mathematics of group theory" (xv).

Mathematics + Art
Mathematics + Art
For young scholars the book plays the role of sign-posting schools and history of thoughts and ideas. [Paraphrasing..] Adorno and Horkheimer ... wrote the first in-depth analysis of the loss of confidence in enlightenment ideals, a condition that came to be called postmodernism (xviii). There's an observation of artists being inspired by mathematics, but not mathematicians drawing upon art - with some rare exceptions. When possible, Gamwell's approach to the personality and intellectual environment of mathematicians and artists is psychological (noting key traumas), at others the author adopts a more sociological and cultural stance. The prose throughout is clear and flows very well, even with some inevitable and necessary cross-referencing.

Chapter 1 Arithmetic and Geometry brings home the relationships and dependencies between maths, arts, belief and changes in our understanding of the Universe. When I learned in my teens of the destruction of the Library of Alexandria, which Ptolemy would have visited, (p.30) I was shocked and still am at this loss. Sadly a loss that is not just an ancient phenomenon.* Interested in astronomy, the loss of Hipparchus's globes and co-ordinate system is a further blow. A cross-cultural perspective is maintained throughout the book, with Islamic mathematics, South America and Asia. Do you know the difference between philosophy and mathematics? There is an opinion here. From the Greeks - Neoplatonism, early Christian and medieval thought and the 'liberal arts', I knew the modern book version of the 'Quad-rivium' on my shelf was of significance:
"In the late Roman and early Christian era, scholars continued to study the ancient texts based on a curriculum - arithmetic geometry, music, and astronomy (the quadrivium, Latin combination of quadri and via meaning "the place where four roads meet") - first described by the Pythagoreans and adopted by Plato for his Academy." (p.37)
An original purpose for Hodges' model, remains curriculum planning and development, the definition of the core disciplines of learning has always been a roll call of sorts. The book can serve all, but younger scholars especially, as it sets out the formulation of scholastic traditions which have a chapter each:
  1. logicism (chapter 5): Realism - St Augustine - Platonic realm
  2. intuitionism (chapter 6) - Conceptualism - Peter Abel - distinct objects only in the mind
  3. formalism - (chapter 4) Nominalism - William of Okham - mere signs or names (p.37)
Even today we must ponder on the status of the seven liberal arts, the quadrivium plus the trivium of grammar, rhetoric and logic. To classics scholars this will be introductory, but invaluable grounding for many learners - young and more senior.

There is an account of eastern and western cultures and the relative development of mathematics. The sciences and theology feature markedly as human reason made progress - increasing certainty only to suffer from doubt with new discoveries. The 'via negativa' (Latin for "negative way", p.47) reminded me of two books on ignorance I purchased in London. I arrived there March 12th and soon thought; "What on Earth (as a nurse too) am I doing here?" Especially, being in the basement for Jazz Live at Pizza Express, Soho. These are indeed uncertain and challenging times.

You may have noticed I have not mentioned the art thus far. Well there is plenty. By page 47 we are up to plate 1.52 'The Cloud of Unknowing' 1998 by Roman Verostko.

Post iii soon.

*In lockdown I followed a conversation on the destruction of libraries from the digital Hay Festival:

(This does require a subscription to Hay Player.)

Friday, June 28, 2013

Visual representation of nature - energy ASEH2014

I subscribe to quite a few mail lists including the H-ENVIRONMENT list at H-NET. The post below caught my attention being always intrigued by diagrams and how they are applied. Caleb Wellum's post - copied below with thanks - stood out, not so much for the panel and being there (San Francisco!) as the theme.

By Mdd at the English Wikipedia, CC BY-SA 3.0, https://commons.wikimedia.org/w/index.php?curid=38159397
Dear Colleagues,

I am organizing a panel about the visual representation of nature (and the politics of different representational forms) for ASEH 2014. My paper will examine H.T. Odum's energy diagrams in his popular 1970s works "Environment, Power, and Society" and "Energy: Basis for Man and Nature."

Michael Clemens will discuss nature documentaries at the National Film Board of Canada in the 1960s and 1970s and Duygu Kasdogan will be doing a visual ethnography of biofuels. We are looking for a 4th person to round out our panel. Your paper can be about any period, region, or form of visual representation.

Sincerely
Caleb Wellum
PhD Candidate
University of Toronto

Thursday, February 28, 2008

Holistic Bandwidth [II] 16, 180, breadth, depth and thoughts initial

If we were able to put the care record into an appropriate text analysis program is there a measure of the conceptual span - the holistic bandwidth of care - somewhere in there? Could there be a disciplinary or task-based mesh, a tag cloud that could be superimposed on Hodges' model to represent care as holistic bandwidth?

Very early on in the web site's history a page was added on the multicontextual nature of health (and social care). This contexts page like the others has not been properly researched, which I recognise is a risk for readers in terms of 'evidence based sources' and a risk for me since of course the Web is a rather public arena to air initial thoughts.

Since the site and this blog are a call for research in this area, I'm sure a search would reveal a literature, but without recourse to said literature I'm not sure how explicitly - my incomplete - notion of holistic bandwidth has been studied in care contexts. On the context page I included several basic diagrams to indicate how Hodges' model might be used as a 'measure'. This page plus the others need revising with a bin (icon) close to hand, in the meantime how can we measure holistic bandwidth?

We could add the problems identified in each care domains, e.g.:

INTRA-interPERSONAL = 3
POLITICAL = 2
SOCIOLOGY = 5
SCIENCES = 6
= 16

Continuing in a fit of numerics we could throw in some multiplication - 3*2*5*6 = 180 ?
'180' is much more impressive than a paltry '16'.

What next...? Could the domain scores be weighted in some way? Is it valid to assign a primary domain? And while we are at it where does self-care fall (intra-interpersonal surely)? Wither the literary heavyweights of severity, chronicity, strengths, recovery and well-being. ...? Oops - how could I forget - dependency measures are nothing new; but the literature bearers are not the issue.

If we still frequently fail to deliver holistic care, then what is holistic bandwidth (actually measuring)? Is it -

  • The scope of care [in one or all of - assessment, planning, intervention, evaluation, outcome]?
  • Simplicity [breadth]?
  • Complexity [breadth and depth]?
  • (Rapid) care integration [time, connectedness]?
  • Concordance: clinical problems + patient (carer) problems + outcome set?
  • ....?

Thursday, January 16, 2014

Book review: Values-Based Commissioning of Health and Social Care

This book was a welcome change from the last review, being quite brief in comparison at 155 pages including the index. This isn't a criticism, it just helps in clearing the decks for other reading and distance learning.

The text is no lightweight, however; and should be mandatory reading for all health and social care personnel. Well maybe not all; but that is part of the problem. The clinical and social care workforce are trained to care. Commissioning (and clinical coding) is something done in another location, by other personnel.

If there is a recurring criticism of public services it is that they are cossetted, protected, removed from many of the financial realities of the world. The book, published in 2012, was written anticipating the structural and financial change brought in by the Coalition government and the need for austerity. Therefore, the public sector and clinical staff are not  immune from the vagaries of finance as might be assumed. For the past couple of years I've witnessed the regular shakes of the sieve and heard of the same within local authorities.

Christopher Heginbotham's book provides the background and tensions of commissioning and delivers much needed insight on several fronts by conjoining what so often seems remote. The lesson of the book for me is how distinct finance and commissioning are. I can sum this up as: if person-centred clinicians are concerned with sense-making for and with patients and their families, then commissioning is the sense-making of the available finance. Viewed this way you see the importance of commissioning.  Clinicians are concerned with evidence-based care, ethics, the health reforms, outcomes, quality, and of course values. Add to this patient involvement and public engagement and you have a read that opens a field that many clinicians dash by (in the public sector?*) as they manage various clinical priorities.

Chapter 1 and 2 set the scene of values-based commissioning, definitions, the fact-value distinction; and the post-Labour NHS. The health reforms (chapter 3) are central to the text, but despite the date of publication which the author acknowledges there is little loss of significance. The health and social care commissioning landscape is still taking shape, outcomes based commissioning (chapter 9) can make the news as implementation is delayed (Williams, 2013). Chapter 4 describes the seven fat years followed by seven lean years; an excellent overview with the major influences at work, The Wanless Reports and Marmot Review for example. It is salutary in these times to see NPfIT as a footnote, with IT benefits still to be accrued (p.32). The need to respond to the public health challenges are noted (chapter 6), as with the potential mental health impact of climate change.

The book's figures and tables are a great asset, very useful to educate student nurses about commissioning, value and values. There are a couple of references to colour (p.72) in what are black and white - grey illustrations. 'Reading' the diagrams you can follow them. The author's background comes across, as with location and mental health experience. The book is I believe relevant to readers across all sectors. Heginbotham also indicates that the book is one of a series by CUP, and points to Fulford et al. as a sibling. There are a couple of repeated words but otherwise the production is excellent.  I was a little surprised to find a catastrophe in the text - catastrophe theory (p.51). It is well deployed in explaining complexity and values. When I say surprised perhaps I would really like to see more on this theme of complexity and emergence, but Mr Heginbotham stays clearly on track.

My bias - Hodges' model - found the following standout points:

http://www.cambridge.org/gb/academic/subjects/medicine/medicine-general-interest/values-based-commissioning-health-and-social-careThe number of sentences and figures that describe the individual, group, community and population (the structure of Hodges' model). The way that values can act as a counterpoint and essential adjunct to evidence (subjective - objective; qualitative - quantitative).

Some situations are more biological than others - in certain sorts of surgery, for example - and some have a much larger values base - such as in psychiatry (p.40).

 Reference to (Cronje and Fullan, 2003):

The medical literature demonstrates an equivocal attitude which suggests a 'collective need to better integrate scientific quantitative data . . . and the art of human judgement . . . into a common definition of "rational" medical practice (p.40).
Figure 7.8 Filtering the evidence through a values-based matrix (values across four care domains?).

The use of models to test the real world and reference to a values space.

I posted previously about the nhm - new holistic model (p.80).
(back to the review..!)

Technical aspects (a law and index) and ethical issues that beset commissioning are introduced (space is limited), and recur helping to integrate the book as a whole. Chapter 5 deals with public involvement and engagement and how it can be enacted. Chapter 7 on integrative commissioning invariably raises patient and service user care pathways.

Is this the Rorschach test for patient, care professional and commissioner: please draw your care pathway? 

The book admirably deals with the ideal and realised in the space available. As such even when there is a linear care pathway it is how it is experienced that counts (values and outcomes...). (It is sadly the person-affirming life-story pathway that is so often lost.) 

Perhaps, this is what I have in mind above in referring to emergence. Despite the existence of care pathways in practice the route in-through health and social care is probably found in a rather chaotic way (sudden care transitions); with delays, placement changes, ward movement(s)-stasis, choices to be taken into account, lack of attendance, missed appointments. ... This is why trying to define pathways may certainly assist, but it is the granularity of those definitions and their experience that snags at our clothes along the way. As Heginbotham advises - care pathways are not something to use in a slavish way. This excellent and well referenced book should provoke and establish interest in this very important health and social care activity. An activity and process that must be informed by the values of the public and those of patients and be more than a process, but realised in shared purposes and practise.

*When we stop and reflect we also recognise ourselves as tax-payers and so seek value-for money, and the other e's of efficiency, effectiveness, efficacy...

Many thanks to CUP for the copy.

Williams, D. Trust forces delay in outcomes based commissioning plan, Health Service Journal, 6 December 2013. p. 4-5.

Heginbotham, C. (2012) Values-Based Commissioning of Health and Social Care. Cambridge, Cambridge University Press.

Friday, January 10, 2020

Review: vi Kinchin's Visualising Powerful Knowledge to Develop the Expert Student

I have had a look at CMAP Tools over the years. My not actually using this software is an omission I must admit.. This year I will give CMAP a concerted try (and a review)?

My notes at the end of chapter 5 include: from bedside manner to fireside with regard to well-being. I think this was prompted by the conclusion students developing expertise (knowledge structures) not just as part of the curriculum, but motivation to extend their knowledge to "integrate characteristics of their future profession within their current studies" (p.84). My thought points to an increasing challenge to the 'professions' that governing bodies must be acutely mindful of, but also sustains and expands the space for non-professional experts - hence the 'fireside'. In mental health were lived experience continues to be pathologised and governments look to economise (professional rates of pay) this really brings home the future agenda.

Chapter 6 "Embedding Wider Theory" begins with a timeline from the 1960s that identifies key steps in theories, software conferences and journals (p.87).

By default Hodges' model can help transcend differences in terminology and make the links and overlap between the theories of Ausubel (in Psychology) and Bernstein (sociology, p.89). Diagrams being used to depict their respective work and support a more holistic view (my wording). Threshold Concepts are introduced (pp.89-92) and the discussion that follows of semantic gravity is a great insight (pp.93-100) together with the idea of punctuated learning. Perhaps the latter is also assisted by having a conceptual Swiss army knife ready-to-hand for when a burst (a step) of learning is initiated? There are many quotes here that I might return to later in the year.

As a student previously and mentor feedback is central and chapter 7 builds on chapter 6 and continues a call for change in feedback on learning AND teaching. 'Recipience' is stressed with its own section (pp.111-12); students may bemoan a lack of feedback but when provided do they engage with it? The book is rich throughout including this chapter and chapter 8 (final). As already noted an index would help, but I'm still bound to consider the related titles.

These posts have been text heavy, but for illustration purposes, the pièce de résistance is figure 44 on page 124:


Figure 44, page 124

I wonder if there is a common model that can act as a generic structure for readers and students disciplinary AND experiential knowledge structures?


Roland Tormey (2014) The centre cannot hold: untangling two different trajectories of the ‘approaches to learning’ framework, Teaching in Higher Education, 19:1, 1-12.
DOI: 10.1080/13562517.2013.827648

Novak, J.D. and Symington, D.J. (1982) Concept mapping for curriculum development. Victoria Institute for Educational Research Bulletin, 48: 3–11.

Kinchin, I., (2016) Visualising powerful knowledge to develop the expert student. Rotterdam: Sense Publishers.


Many thanks to Brill for the review copy:

https://brill.com/view/title/37823

BRILL  | Plantijnstraat 2 | 2321 JC Leiden | The Netherlands
BRILL  | P.O. Box 9000 | 2300 PA Leiden | The Netherlands


See also:

Intro post

Review One

Two

Three

Four

Five

Sunday, October 30, 2022

An observational record and learning from 30,000 years ago

"A fascinating example is the shoulder blade of an ox unearthed in the 1980s (Figure 1) by archaeologists investigating a stone age encampment in the south of France. Carbon dating showed this to be approximately 30,000 years old. The bone was marked with inscriptions that the archaeologist couldn't decipher. It was clear they were neither a tally, nor a pattern, nor any recognisable form of writing. Late one night one of the archaeologists noticed the moon, and something in its shape caught his curiosity.

Aurignacian Lunar Calendar / diagram, drawing after Marshack, A. 1970; Notation dans les Gravures du Paléolithique Supérieur, Bordeaux, Delmas / Don’s Maps
Figure 1 my source: https://sservi.nasa.gov/articles/oldest-lunar-calendars/

Then it struck him. Here, on this fragment of bone, was a lunar calendar complete with 72 observations ... something like 1,600 generations ago. One of our common ancestors (statistically, all of us can claim a relationship to this thoughtful person) 30,000 years ago had the intellectual curiosity to watch the moon, night after night, and then transcribe these movements, at scale, onto the stone age equivalent of the back of an envelope, as he (or she) attempted to "think it through". What makes us human is our ability to think, learn and adapt to our changing environment. The story of the stone age learner gets even better when you imagine a small community of people (adults, adolescents, children on their laps) sitting around a campfire every night working out the meaning of the lunar phases together." pp.72-73.

Abbott, J. & Ryan, T. (2000). Chapter 4, How mass education eclipsed apprenticeship, The Unfinished Revolution: Learning, Human Behavior, Community, and Political Paradox, Stafford, UK: Network Educational Press. (The figure in the book does not include the bone.)

Previously: 'diagrams' , 'archaeology'

[I am also still trying to clear papers and books, as some posts will suggest.]